Difference between revisions of "1299: I Don't Own a TV"
(→Explanation: other forms of entertainment; removed extra comma (m)) |
|||
| Line 7: | Line 7: | ||
}} | }} | ||
| − | == Explanation == | + | ==Explanation== |
| − | |||
This comic is a [[:Category:Charts|yet another graph]], describing how people who don't own a television feel, throughout several time periods. While televisions have existed since 1928, regular scheduled broadcasts of television programs did not begin until the late 1940s. So before the 1950s, it was common not to own a television and therefore most people's feelings about it would be fairly neutral. This changed as televisions became cheaper and more people started owning them, meaning that if someone didn't own a television, it was generally because they couldn't afford one. This might lead to someone feeling embarrassment when admitting they don't have a television. | This comic is a [[:Category:Charts|yet another graph]], describing how people who don't own a television feel, throughout several time periods. While televisions have existed since 1928, regular scheduled broadcasts of television programs did not begin until the late 1940s. So before the 1950s, it was common not to own a television and therefore most people's feelings about it would be fairly neutral. This changed as televisions became cheaper and more people started owning them, meaning that if someone didn't own a television, it was generally because they couldn't afford one. This might lead to someone feeling embarrassment when admitting they don't have a television. | ||
| − | Gradually, television ownership increased until eventually, nearly every household had at least one television, and those that did not were more and more likely to do so by choice rather than due to poverty. The graph therefore peaks at around the year 2000, when many people would be proud to say that they did not own a television. [[Randall]] suggests that these people would feel smug because they are resisting a popular trend (owning a television) which the rest of the public take part in. The graph tails downwards at the end, suggesting that Randall believes that people are becoming less smug. This could be because of the abundance of video content | + | Gradually, television ownership increased until eventually, nearly every household had at least one television, and those that did not were more and more likely to do so by choice rather than due to poverty. The graph therefore peaks at around the year 2000, when many people would be proud to say that they did not own a television. [[Randall]] suggests that these people would feel smug because they are resisting a popular trend (owning a television) which the rest of the public take part in. The graph tails downwards at the end, suggesting that Randall believes that people are becoming less smug. This could be because of the abundance of video content and other forms of entertainment on the internet and mobile devices. So, according to Randall, people are returning to not owning a television simply because it's not necessary and these people therefore feel neutral towards their lack of a television. |
The initial upturn from embarrassment to smugness may also be a commentary on the quality of television programs over that period. In the 1950s and 1960s, television was a major source of news and information. Those without televisions might feel that they were missing out of the important stories of the day. Also, the limited number of stations and lack of recording devices meant that discussions of the previous night's television programming was far more inclusive, with more people watching the same programs at the same time. Until the advent of PVRs, the prior night's television programming was a popular "water cooler" topic (i.e. something discussed socially at the office the next day). This means that that those who had missed out on those programs might feel socially "out of the loop". | The initial upturn from embarrassment to smugness may also be a commentary on the quality of television programs over that period. In the 1950s and 1960s, television was a major source of news and information. Those without televisions might feel that they were missing out of the important stories of the day. Also, the limited number of stations and lack of recording devices meant that discussions of the previous night's television programming was far more inclusive, with more people watching the same programs at the same time. Until the advent of PVRs, the prior night's television programming was a popular "water cooler" topic (i.e. something discussed socially at the office the next day). This means that that those who had missed out on those programs might feel socially "out of the loop". | ||
| Line 17: | Line 16: | ||
By contrast, since 2000, many programs were criticized as poor quality or "mindless", e.g. daytime talk shows and reality shows. So, someone might feel more smug for not watching so-called "mindless television". Similarly, as television viewership increased from the 1950s through the 2000s, it is possible that other activities such as reading has decreased; especially given that the younger generation today don't remember a time without television. So, someone who did not own a television set might feel more smug because they take part in more "beneficial" activities like reading, exercise, and studying. | By contrast, since 2000, many programs were criticized as poor quality or "mindless", e.g. daytime talk shows and reality shows. So, someone might feel more smug for not watching so-called "mindless television". Similarly, as television viewership increased from the 1950s through the 2000s, it is possible that other activities such as reading has decreased; especially given that the younger generation today don't remember a time without television. So, someone who did not own a television set might feel more smug because they take part in more "beneficial" activities like reading, exercise, and studying. | ||
| − | The title text suggests that whether people feel embarrassed or smug doesn't depend directly on what percentage of the population owns TVs (TV ownership rate) or even on how quickly this percentage is growing (derivative of TV ownership rate with respect to time); instead it depends on how the change in this percentage is speeding up or slowing down (second derivative of TV ownership rate with respect to time). | + | The title text suggests that whether people feel embarrassed or smug doesn't depend directly on what percentage of the population owns TVs (TV ownership rate) or even on how quickly this percentage is growing (derivative of TV ownership rate with respect to time); instead it depends on how the change in this percentage is speeding up or slowing down (second derivative of TV ownership rate with respect to time). Specifically, as the rate at which people adopt TV ownership accelerates (positive second derivative of TV ownership rate with respect to time), people who don't own one feel embarrassed (negative smugness); and as the market is saturated and the rate at which people adopt TV ownership slows down (negative second derivative of TV ownership rate with respect to time), people who don't own one feel smug (positive smugness). If people feel twice as embarrassed/smug when this rate of acceleration/deceleration doubles, then we have Randall's formulation: "smugness is proportional to the negative second derivative of TV ownership rate with respect to time". |
As evidence for this, the adoption of TV ownership should theoretically follow a {{w|Sigmoid function|sigmoid curve}}, which is the graph of something that starts small, grows in a spurt, and then approaches a maximum capacity (in this case 100%). The negative second derivative of a sigmoid curve looks very much like Randall's graph. | As evidence for this, the adoption of TV ownership should theoretically follow a {{w|Sigmoid function|sigmoid curve}}, which is the graph of something that starts small, grows in a spurt, and then approaches a maximum capacity (in this case 100%). The negative second derivative of a sigmoid curve looks very much like Randall's graph. | ||
Revision as of 02:23, 6 September 2014
| I Don't Own a TV |
 Title text: Theory: Smugness is proportional to the negative second derivative of TV ownership rate with respect to time. |
Explanation
This comic is a yet another graph, describing how people who don't own a television feel, throughout several time periods. While televisions have existed since 1928, regular scheduled broadcasts of television programs did not begin until the late 1940s. So before the 1950s, it was common not to own a television and therefore most people's feelings about it would be fairly neutral. This changed as televisions became cheaper and more people started owning them, meaning that if someone didn't own a television, it was generally because they couldn't afford one. This might lead to someone feeling embarrassment when admitting they don't have a television.
Gradually, television ownership increased until eventually, nearly every household had at least one television, and those that did not were more and more likely to do so by choice rather than due to poverty. The graph therefore peaks at around the year 2000, when many people would be proud to say that they did not own a television. Randall suggests that these people would feel smug because they are resisting a popular trend (owning a television) which the rest of the public take part in. The graph tails downwards at the end, suggesting that Randall believes that people are becoming less smug. This could be because of the abundance of video content and other forms of entertainment on the internet and mobile devices. So, according to Randall, people are returning to not owning a television simply because it's not necessary and these people therefore feel neutral towards their lack of a television.
The initial upturn from embarrassment to smugness may also be a commentary on the quality of television programs over that period. In the 1950s and 1960s, television was a major source of news and information. Those without televisions might feel that they were missing out of the important stories of the day. Also, the limited number of stations and lack of recording devices meant that discussions of the previous night's television programming was far more inclusive, with more people watching the same programs at the same time. Until the advent of PVRs, the prior night's television programming was a popular "water cooler" topic (i.e. something discussed socially at the office the next day). This means that that those who had missed out on those programs might feel socially "out of the loop".
By contrast, since 2000, many programs were criticized as poor quality or "mindless", e.g. daytime talk shows and reality shows. So, someone might feel more smug for not watching so-called "mindless television". Similarly, as television viewership increased from the 1950s through the 2000s, it is possible that other activities such as reading has decreased; especially given that the younger generation today don't remember a time without television. So, someone who did not own a television set might feel more smug because they take part in more "beneficial" activities like reading, exercise, and studying.
The title text suggests that whether people feel embarrassed or smug doesn't depend directly on what percentage of the population owns TVs (TV ownership rate) or even on how quickly this percentage is growing (derivative of TV ownership rate with respect to time); instead it depends on how the change in this percentage is speeding up or slowing down (second derivative of TV ownership rate with respect to time). Specifically, as the rate at which people adopt TV ownership accelerates (positive second derivative of TV ownership rate with respect to time), people who don't own one feel embarrassed (negative smugness); and as the market is saturated and the rate at which people adopt TV ownership slows down (negative second derivative of TV ownership rate with respect to time), people who don't own one feel smug (positive smugness). If people feel twice as embarrassed/smug when this rate of acceleration/deceleration doubles, then we have Randall's formulation: "smugness is proportional to the negative second derivative of TV ownership rate with respect to time".
As evidence for this, the adoption of TV ownership should theoretically follow a sigmoid curve, which is the graph of something that starts small, grows in a spurt, and then approaches a maximum capacity (in this case 100%). The negative second derivative of a sigmoid curve looks very much like Randall's graph.
Transcript
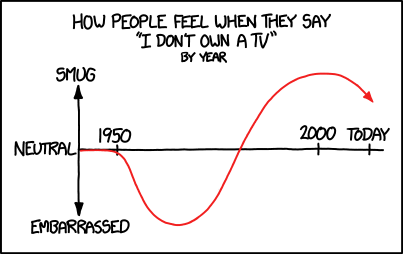
- [A graph is shown with an x- and y-axis.]
- How people feel when they say
- "I don't own a TV"
- by year
- [The x-axis is labled: 1950, 2000, today.]
- [The y-axis is labled neutral at zero, smug at top, and embarrassed to the bottom.]
- [A plot, similar to a negative sine curve between approximately 1960 and 2000, is shown in red, starting at 1950, moving into negative values, reaching the zero level again at the beginning of the 1980s, reaching its maximum shortly after 2000, and decreasing again until today. An arrow shows the current direction.]
Discussion
Annual Data for households between 1958-1970 http://www.tvhistory.tv/Annual_TV_Households_50-78.JPG
Plotted next to a fitted logarithmic function http://imgur.com/aVWmQ9z
The negative second derivative of this function http://imgur.com/xywpEJZ
If someone can find more data for television ownership I'd love to see it :) 173.245.54.12 (talk) (please sign your comments with ~~~~)
Can someone explain why Randall believes smugness at not owning a television is decreasing? 199.27.128.138 08:31, 4 December 2013 (UTC)
Because as TVs become less relevant, people don't feel smug for not owning one. 141.101.99.216 11:44, 4 December 2013 (UTC)
- Current explanation - logistic curve
The current explanation is total bullshit. The thing with the negative second derivative is just saying, that the more embarrased people are, the more the change of the TV ownership rate will increase, which just means, more and more people will get themselves TVs. The other point of view is, the more smug you will look like for not owning a TV, the more the change of the TV ownership rate will decline, which means, that less and less people are buying TVs.
It has nothing to do with a logistic curve. The function, which second derivative is depicted in this comic is totally irrelevant.
108.162.231.19 08:34, 4 December 2013 (UTC)
I have the strong feeling he is talking about a sine wave, not a logistic function. It fits the curve in the comic as well as the condition of f"=-f. Also, it makes way more sense for the smugness to behave like this over time as for the first 30 years TV is culturally extremely significant and you therefore would want to own one in order to participate. But with declining quality of television and the emergence of the internet you might feel as if you were extremely progressive by not owning one anymore.
108.162.254.189 09:25, 4 December 2013 (UTC)
Yes, it definitely could be a sine curve. (see: http://www.wolframalpha.com/input/?i=d%5E2%2Fdx%5E2%28sin%28x%29%29). If one would neglect the beginning of the function for simplicity, this could be a solution.
108.162.231.19 10:07, 4 December 2013 (UTC)
We bid a tearful farewell to our friend the line break. 141.101.99.216 11:50, 4 December 2013 (UTC)
http://www.wolframalpha.com/input/?i=sin%283*pi*x%2F100%2Bpi%2F2%29+from+1945+to+2014 Xhfz (talk) 12:02, 4 December 2013 (UTC)
I agree with the commenter who said that the current explanation is bullshit, but I think he has the cause and effect reversed. Randall is saying that you feel more smug about not owning a TV as a result of observing how quickly TV ownership is becoming more or less trendy. In the 1950's, TV's were catching on quickly and becoming more popular, so you would feel embarrassed for not owning one. Later, the trendiness would start to decline as more people owned one, and you would head towards being smug. In the 2000s, people are giving up TVs because the internet makes them unnecessary. As this happens more and more, there's no point in feeling smug because you're no longer bucking a trend at all. --Kazim (talk) 12:49, 4 December 2013 (UTC)
In my view the title text joke is that smugness is defined as a function of TV ownership when in reality TV ownership is a function of smugness. Ralfoide (talk) 15:18, 4 December 2013 (UTC)
Hold on, the logistic curve gives very reasonable graphs both for ownership of TVs and for the negative second derivative. TV ownership easily fits a logistic curve, as it starts at zero and has to approach some upper limit. The negative second derivative has a very similar shape to the graph in the comic. Here's Wolfram|Alpha for the negative second derivative of a generic logistic curve: <http://www.wolframalpha.com/input/?i=-%28+d%2Fdx+d%2Fdx+%28100%2F%281%2Be%5E-%28.1x%29%29%29%29>. This would suggest that as time goes to infinity, people's feelings about TV ownership approach neutral; they do not oscillate like a sine function. This makes sense, because for the negative second derivative to be a sine function, TV ownership would have to be too, yet TV ownership is unlikely to be periodic. 173.245.55.229 16:28, 4 December 2013 (UTC)
I have two issues with this explanation: the first is that it's too long to comfortably read, and I don't think the comic content merits such a long explanation. The other is that it reads too complexly. The point of this wiki is to make xkcd accessible for everyone, but it talks about things like sine waves, oscillation and convergence, which not all readers are going to grok. --Mynotoar (talk) 17:24, 4 December 2013 (UTC)
If we're keeping the explanation surrounding the area of "People therefore discussed television programs frequently, as a major social activity.", it maybe ought to be pointed out that major social discussions about TV programmes dropped off as a result of the increase in the number of TV channels and thus (except for particularly notable ratings-grabbers) the question of "Did you see what was on TV last night?" increasingly needed further qualifying. (However, I'm not sure this is revelevant.) Oh, and I've a feeling I should be feeling smug, right now. Absolutely gorge myself on radio, though. 141.101.99.229 21:18, 4 December 2013 (UTC)
I do not see any evidence that this comic's title text refers in any way to a sine curve. If you consider a logistic function modeling TV ownership over time (which would look the similar to a logistic population growth model), you can take the function's second derivative, which vaguely resembles a sine curve, with the important difference that to the sides of the curve, the line becomes more level rather than repeating the curve. I would say the determining factors are the fact that the beginning of the graph is flat (as opposed to the curve just going to zero or showing the end of the previous curve), and the fact that he mentions the "negative second derivative of TV ownership rate," and the TV ownership rate would follow a model similar to a logistic population model, which is not a sine curve, though the second derivative of such a graph would, in fact, represent a sine curve. --Zweisteine 21:36, 4 December 2013 (UTC)
Not sure if I'm coming in at the end of an edit war and pouring fuel on the argument, but I think the whole smugness/TV ownership / Programming comments are well made before the last paragraph. I'm confident that Randell's title text is a superficial comment about the shape of the graph. I've edited the last paragraph so there's no mention of sine waves, oscillation, convergence, or interpretation of where the graph starts or where it's going (that seems subjective to me). Just a link to what a "negative second derivative" is, and a statement that the comic resembles that chart. XQx (talk) 01:02, 5 December 2013 (UTC)
Except that graph does closely represent the second derivative graphs I've seen for graphs that start slow, rise suddenly, then level out again, like a population chart, or a chart showing TV ownership over time. Zweisteine (talk) 01:18, 5 December 2013 (UTC)
I think that, theoretically, something closer to an arctangent fits the number of televisions over time graph better than a logarithmic curve- at least if we consider some of the thousands of years during which nobody owned televisions. Linked below is a plot of arctan(x-2) + 1.3 and its negative second derivative (scaled to fit better in WolframAlpha's output window), the latter of which looks as much like the smugness graph in the comic as anything I've seen so far. http://www.wolframalpha.com/input/?i=plot+atan%28x-2%29+%2B+1.3%2C+6%28x-2%29%2F%28x^2-4+x%2B5%29^2+for+x+%3D+0..4 --173.245.56.24 03:45, 5 December 2013 (UTC)
While the previous explanation of the title text involving the sine function was bogus (it's the second derivative of TV ownership rate, not the second derivative of smugness), the stuff about logistic (or arctangent or other sigmoid) functions is correct (if you believe that TV ownership should follow a sigmoid curve). I think that this can be explained, so I've put that in; hopefully, one can read it without the parentheses to get something understandable to lay folk, and then the parentheses show where Randall's mathematical jargon comes in. —TobyBartels (talk) 04:59, 5 December 2013 (UTC)
The "this is incomplete because it needs further information" is not much of an explanation of what needs to be completed. It looks like the tag was added when the explanation was really, really poor and it't now obsolete. I would update it if I could figure out something that is still missing, but at this moment it looks like removing it altogether could be a better option. 173.245.53.117 09:54, 5 December 2013 (UTC)
- Agreed. Removed. —TobyBartels (talk) 17:28, 5 December 2013 (UTC)
One obvious problem with the data is that one does not maintain a level of smugness and thus the chart dips eventually, as in the graph (but to an unknown extent). The problem is that you don't know the rate of "getting over yourself". Without a TV to remind you that you don't have a TV, you stop feeling smug by getting on with your life. The idea of not having a TV then becomes a different problem if when in conversation you tell anyone that you don't have a TV. This very seldom happens and has its own emotional curves.I used Google News BEFORE it was clickbait 07:36, 10 January 2015 (UTC)
I feel quite smug, not having to pay £145.50 a year to watch people wanting to be famous, or wanting to remind people that they used to be famous, screaming for attention on "Strictly Got Talent Factor On Ice Brother" 141.101.99.218 16:06, 5 December 2013 (UTC)
- As a fellow Britisher, similarly not paying for (or needing!) a TV Licence, I think this might need explaining to the furriners here. There are different payment methods (
up todown to, and including, purely commercial channels, but also the same cable/satelite subscriptions as we might also have to make) supporting TV channels, elsewhere. And how do you deal with the TV Licencing people, pestering you about your TV that you (I presume) do not have? 141.101.99.229 02:05, 6 December 2013 (UTC)- 5 simple words: "I don't have a TV" and they go away for a couple of years. 141.101.98.211 11:27, 6 December 2013 (UTC)
Getting threatening letters from the licensing authority tends to irritate. It is related to other non-smug effects of not having a TV such as the people in charge of TV progammes' support of every human ailment from STOOOPID to paedophilia.I used Google News BEFORE it was clickbait 07:36, 10 January 2015 (UTC)
- Sigmoid function or Sine curve
I'm sorry, but the Sigmoid function doesn't fit the graph. A sine looks much more closer but in fact it is some like f(x) + g(x), the second part looks much more like a sine (but also not accurate) while the first part looks different. And only the second derivative on this graph is important. So g(x) looks similar to a sine and the second derivative shows just an inverted plot, that's the point. There is no real math function.--Dgbrt (talk) 20:39, 5 December 2013 (UTC)
- Back-tracing the provided graph, the (negative) second derivative is clearly near zero up until nearly 1950, declines to a minima around 1965 (it appears to be around 40 pixels per decade, along the scale) before crossing the zero mark at 1980 to a maxima around 2001/2002-ish, then falling again.
- Thus the (positive) first derivative (with an unknown constant of offset) is near horizontal until the 1950s, rises to its steepest in 1965 (i.e. the acceleration in rate of growth is the highest... consistent the uptake of the 'new' technology being popular), continues upwards but finally hits a maxima (in actual rate of growth of TV ownership) in 1980, before tailing off (probably still a rate of increase, but near saturation level. Just after the millenium is around the time I'd expect to see a rise in Large Screen TVs being sold (plasma TVs were late '90s, and we're starting to see proper flatscreen LCDs and, later, OLED versions).
- So, can we relate that to the 'zeroeth' derivative? (i.e. The actual rate of TV ownership... or is it sales..? May be both if you allow for multi-TV homes.) Starting at zero ownership, there was a slow uptake around the 1950s (for the UK, 1953 - the year of the Coronation - was supposed to be the start of the mass-market TV revolution, but perhaps only around one house a street actually getting a TV for the event... still, it'd somewhat match the quick start of the (negative) curve in the cartoon). The mid 1960s was (amongst other things) the height of the Space Race, and thus in the white-heat of that particular phase of technology. By the 1980s, most existing households without TVs weren't going to get them, so uptake would have flattened from that point onwards, until eventually the millenium came about and newer/additional sets were installed in houses during that particular credit-boom and period of techno-consumerism.
- IIW, I think it matches a (convoluted, multi-inflected) S-curve from zero on upwards. Possibly beyond 100% if multi-TV ownership counts to technically allow the original curve to strike up above that value. I may have zero TVs operating in my house but most families I know have at least two of them. 141.101.99.229 02:05, 6 December 2013 (UTC)
As you (Dgbrt) say, the sine curve doesn't fit the beginning (and it would require TV ownership rate to also fit a sine curve, which is implausible). But the sigmoid curve fits it fine! People above have posted some negative second derivatives of sigmoid curves, and they match the graph. Here is a broad selection: 0, 1, 2, 3, 4, 5, 6 (list derived from Wikipedia's article). I think that Randall's curve fits best between 1 and 2 (it all breaks down when you get to 6). —TobyBartels (talk) 04:53, 6 December 2013 (UTC)
- Am I blind or do I hallucinate? The sigmoid curves look very different, just let's say it is a graph and explain the second derivative.--Dgbrt (talk) 11:47, 6 December 2013 (UTC)
- The main point of this seems to be smugness being relative to how odd you are compared to the average. The problem here is the oddness is by choice or simply you can't afford one in the early days. The difference towards the more modern era will be that people will feel smug for not having a TV, but may also feel smug for owning way above average many TVs. Other options also should have altered the graph, such as multi-function TV/Monitors(which I'm using mostly for a monitor and occasionally as a TV for science documentary) and smart phones/tablets which got TV functions, on the other hand, people may own a TV as part of a home entertainment system, which means what is showed in the channels is completely irrelavent. The increase of options has reduced the smugness for not owning one, because there are so many things with a TV function and so many things a TV can do, not owning one means that you are almost technologically isolated, which most would feel embarassed. 173.245.62.228 18:42, 6 December 2013 (UTC)
Check for blindness or hallucination:
- Do you agree that Randall's graph looks more or less like the 7 graphs that I linked above, especially the first few? (Same basic shape.)
- Do you agree that Wolfram Alpha produced those graphs after I properly asked it about the negative second derivatives of various functions? (Check for words "second derivative" and minus sign.)
- Do you agree that these functions are all listed on the Wikipedia page about sigmoid curves? (Graph 0 matches the formula for a logistic function, multiplied by 4 to put it on the same scale as the others; graphs 1 through 6 have the same formula as the graph on Wikipedia comparing six sigmoid curves.)
If you can see all of this, then you are not blind or hallucinating.
Nota bene: nobody is claiming that Randall's graph is itself a sigmoid curve. It is the negative second derivative of a sigmoid curve. This is what it should be, since Randall conjectures that it's the negative second derivative of the TV ownership rate, and the TV ownership rate should follow a sigmoid curve.
—TobyBartels (talk) 06:04, 7 December 2013 (UTC)
- First: Randall does not publish a transcript after the next comic is released because he is laughing about discussions like here.
- But more Randall didn't use a function, he was only talking about the second derivative of that plot.
- So, we just have to explain that derivative, which is still more like a (minus) sine. --Dgbrt (talk) 20:42, 7 December 2013 (UTC)
- Umm... no, actually, "he was only talking about the second derivative" of the (not-shown) TV-ownership function. The smugness plot (depicted) looks quite like the negative second derivatives of sigmoids, doesn't it? -- 173.245.51.210 01:32, 8 December 2013 (UTC)
- Don't worry, nobody is claiming that a sigmoid graph looks like this graph. The claim is that the SECOND DERIVATIVE of a sigmoid graph looks like this graph. See the pictures on the Wolfram Alpha pages that I linked earlier; you will see that most of them (all but the last really, but the earliest ones the best) look like this graph. All of them are computed by Wolfram Alpha as second derivatives of sigmoid graphs; in fact, they are all second derivatives of opposites (negatives) of formulas given on the Wikipedia article as examples of sigmoids. —TobyBartels (talk) 17:37, 10 December 2013 (UTC)
Sigmoid curve:

Second derivative of a sigmoid curve:

Negative second derivative of a sigmoid curve:

vs
Sine curve:

It seems clear to me that the sine curve matches the graph from about 1960, but the negative second derivative of the sigmoid curve (curve 2 from my series above) matches the overall graph better. —TobyBartels (talk) 18:06, 10 December 2013 (UTC)
I think that the new explanation for the title text, while somewhat accurate is a bit overcomplex.
1. There is probably a simpler way to explain what a second derivative is (not necessarily diffently described; it's just a bit jumbled up in the description).
2. For the purposes of explanation, I doubt that so much detail is needed, especially because the real-life meaningfulness of the second derivative of TV ownership doesn't seem like much at all.
I would suggest something like this, but with a bit more depth: The title text sugests that smugness and the second derivative of TV ownership are related. The derivative of a graph is its rate of change at any given point, and the second derivative is the rate of change in the first derivative. Zweisteine (talk) 06:01, 9 December 2013 (UTC)
I disagree with the explanation (to some degree). The thing why people don't feel smug about not owning a TV is because Smart-TV is the new thing. I don't think the program has to do a lot with this trend. It's just Smart-TV is the new cool thing, yet it's still a TV. So instead of just wanting to own a TV many people go to wanting to own a big nice Smart-TV with new features and stuff. Blah! 162.158.83.144 (talk) (please sign your comments with ~~~~)
