Difference between revisions of "12: Poisson"
(Removed redundant links, added new ones) |
|||
| Line 9: | Line 9: | ||
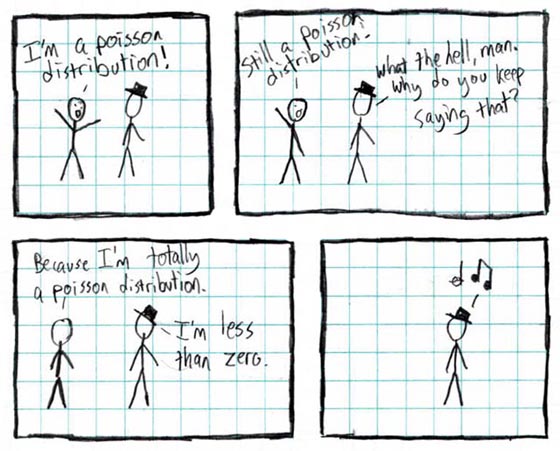
In this comic, [[Cueball]] expresses himself as a Poisson distribution. | In this comic, [[Cueball]] expresses himself as a Poisson distribution. | ||
| − | + | Per Wikipedia, in mathematics, a Poisson distribution is a distribution that shows the probability of a given number of events occurring in a fixed interval of time or space. The horizontal axis typically represents the “number of events” while the vertical axis is a decimal representing the probability (i.e. 0.5 for 50% probability) a given number of events will occur in that fixed interval of time or space. It is commonly represented by a bar graph, or a point graph (sometimes with a line connection to show a trend, even though there is no actual value for non-integers). | |
| − | A simple example is the number of heads coming up on a fair coin flip. | + | A simple example is the number of heads coming up on a fair coin flip. The distribution for one coin flip should be 0.5 at 0 heads and 0.5 at 1 heads; for 2 coin flips, the distribution would be 0.25 at 0 heads, 0.5 at 1 heads and 0.25 at 2 heads; Etc. Multiple graphs like this are sometimes overlaid on one graph with a legend to distinguish the points (one coin flip in red, two coin flips in blue, etc). |
| − | + | What's important to note for this comcic is that this distribution only has data points on non-negative integers and is not continuous through decimal numbers or (as the image text tells us) negative numbers because events can’t occur 0.3 of a time, or -2 times. | |
After implying that the concept of a person being a mathematical distribution is irrational, [[Black Hat]] suggests he is “less than zero”. Since the Poisson Distribution doesn’t exist or has no value at negative values, Cueball either leaves or disappears magically. | After implying that the concept of a person being a mathematical distribution is irrational, [[Black Hat]] suggests he is “less than zero”. Since the Poisson Distribution doesn’t exist or has no value at negative values, Cueball either leaves or disappears magically. | ||
| Line 21: | Line 21: | ||
== Trivia == | == Trivia == | ||
| − | * This is the first appearance of Black Hat in [[XKCD]]. | + | * This is the first appearance of [[Black Hat]] in [[XKCD]]. |
| − | * [[Randall Munroe|Randall]] was still experimenting, as Cueball | + | * [[Randall Munroe|Randall]] was still experimenting, as [[Cueball]] has a face in the first two frames. |
[[Category:Comics|0012]] | [[Category:Comics|0012]] | ||
Revision as of 17:52, 3 August 2012
Image Text
Poisson distributions have no value over negative numbers
Description
In this comic, Cueball expresses himself as a Poisson distribution.
Per Wikipedia, in mathematics, a Poisson distribution is a distribution that shows the probability of a given number of events occurring in a fixed interval of time or space. The horizontal axis typically represents the “number of events” while the vertical axis is a decimal representing the probability (i.e. 0.5 for 50% probability) a given number of events will occur in that fixed interval of time or space. It is commonly represented by a bar graph, or a point graph (sometimes with a line connection to show a trend, even though there is no actual value for non-integers).
A simple example is the number of heads coming up on a fair coin flip. The distribution for one coin flip should be 0.5 at 0 heads and 0.5 at 1 heads; for 2 coin flips, the distribution would be 0.25 at 0 heads, 0.5 at 1 heads and 0.25 at 2 heads; Etc. Multiple graphs like this are sometimes overlaid on one graph with a legend to distinguish the points (one coin flip in red, two coin flips in blue, etc).
What's important to note for this comcic is that this distribution only has data points on non-negative integers and is not continuous through decimal numbers or (as the image text tells us) negative numbers because events can’t occur 0.3 of a time, or -2 times.
After implying that the concept of a person being a mathematical distribution is irrational, Black Hat suggests he is “less than zero”. Since the Poisson Distribution doesn’t exist or has no value at negative values, Cueball either leaves or disappears magically.
Hence, the punchline is the same as the image text: Cueball doesn't exist to Black Hat anymore, because he has a value less than zero.

