Difference between revisions of "User talk:GuiRitter"
m (added template image) |
(found the Java code to treat the image) |
||
| Line 358: | Line 358: | ||
|} | |} | ||
| − | + | {| class="wikitable collapsible collapsed" | |
| + | ! Here's the Java code to treat the image | ||
| + | |- | ||
| + | | | ||
| + | package main; | ||
| + | |||
| + | import java.awt.image.BufferedImage; | ||
| + | import java.awt.image.WritableRaster; | ||
| + | import java.io.File; | ||
| + | import java.io.IOException; | ||
| + | import javax.imageio.ImageIO; | ||
| + | |||
| + | @SuppressWarnings("Convert2Lambda") | ||
| + | public final class Main { | ||
| + | |||
| + | private static int color[] = null; | ||
| + | |||
| + | public static void main(String args[]) throws IOException { | ||
| + | BufferedImage input = ImageIO.read(new File("C:\\Users\\GuiR\\Desktop\\worst_hurricane_large.png")); | ||
| + | WritableRaster raster = input.getRaster(); | ||
| + | for (int y = 0; y < input.getHeight(); y++) { | ||
| + | for (int x = 0; x < input.getWidth(); x++) { | ||
| + | color = raster.getPixel(x, y, (int[]) null); | ||
| + | //if ((color[0] != color[1]) || (color[1] != color[2]) || (color[0] != color[2])) {// it's red | ||
| + | if ((color[0] == color[1]) && (color[1] == color[2])) {// it's not red | ||
| + | color[0] = 255; | ||
| + | color[1] = 255; | ||
| + | color[2] = 255; | ||
| + | } | ||
| + | raster.setPixel(x, y, color); | ||
| + | } | ||
| + | } | ||
| + | //ImageIO.write(input, "png", new File("C:\\Users\\GuiR\\Desktop\\worst_hurricane_large_black.png")); | ||
| + | ImageIO.write(input, "png", new File("C:\\Users\\GuiR\\Desktop\\worst_hurricane_large_red.png")); | ||
| + | } | ||
| + | } | ||
| + | |} | ||
| + | |||
| + | I just used it to separate the red lines from the black lines. | ||
{| class="wikitable collapsible collapsed" | {| class="wikitable collapsible collapsed" | ||
Latest revision as of 13:57, 3 December 2015
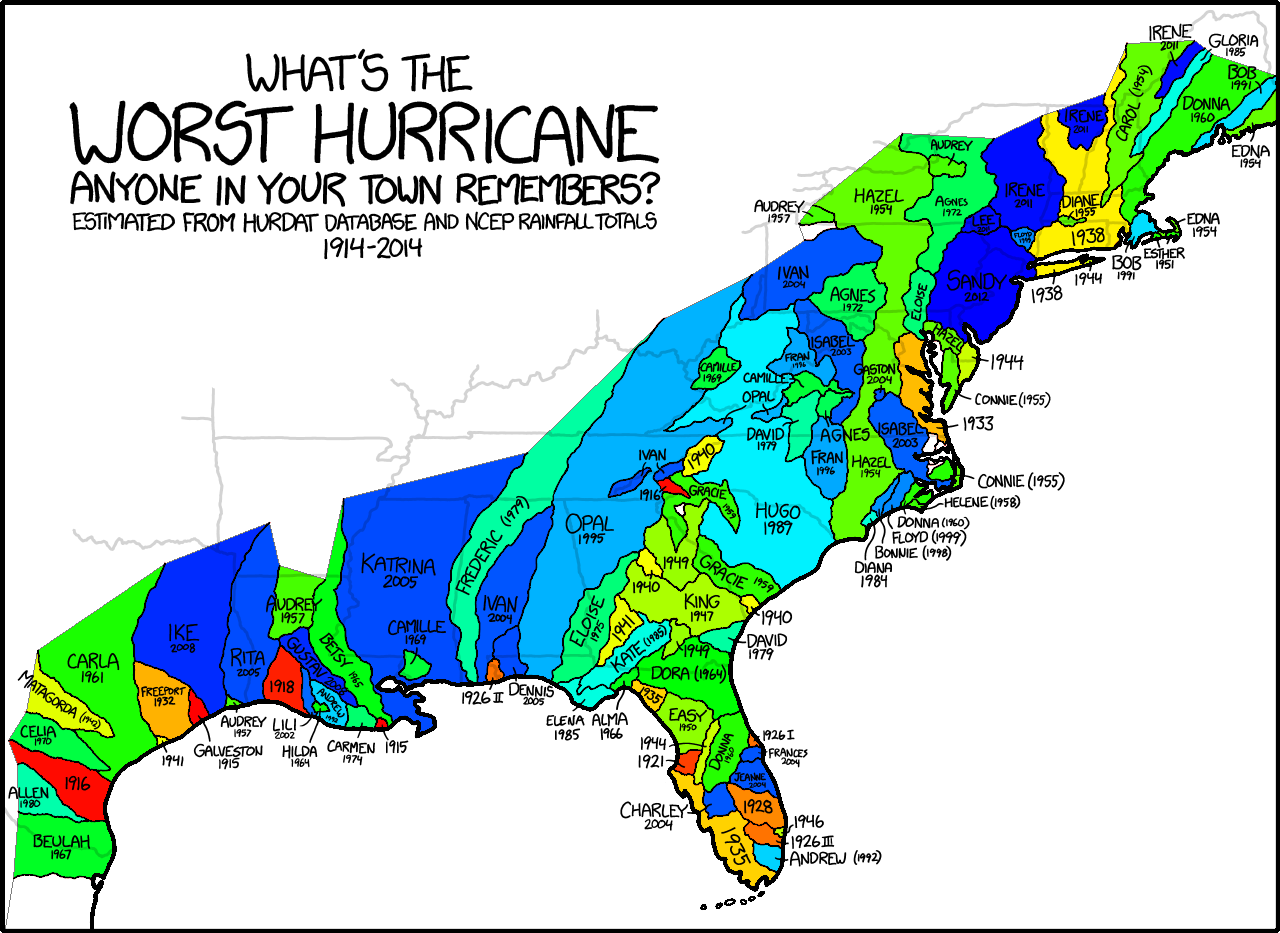
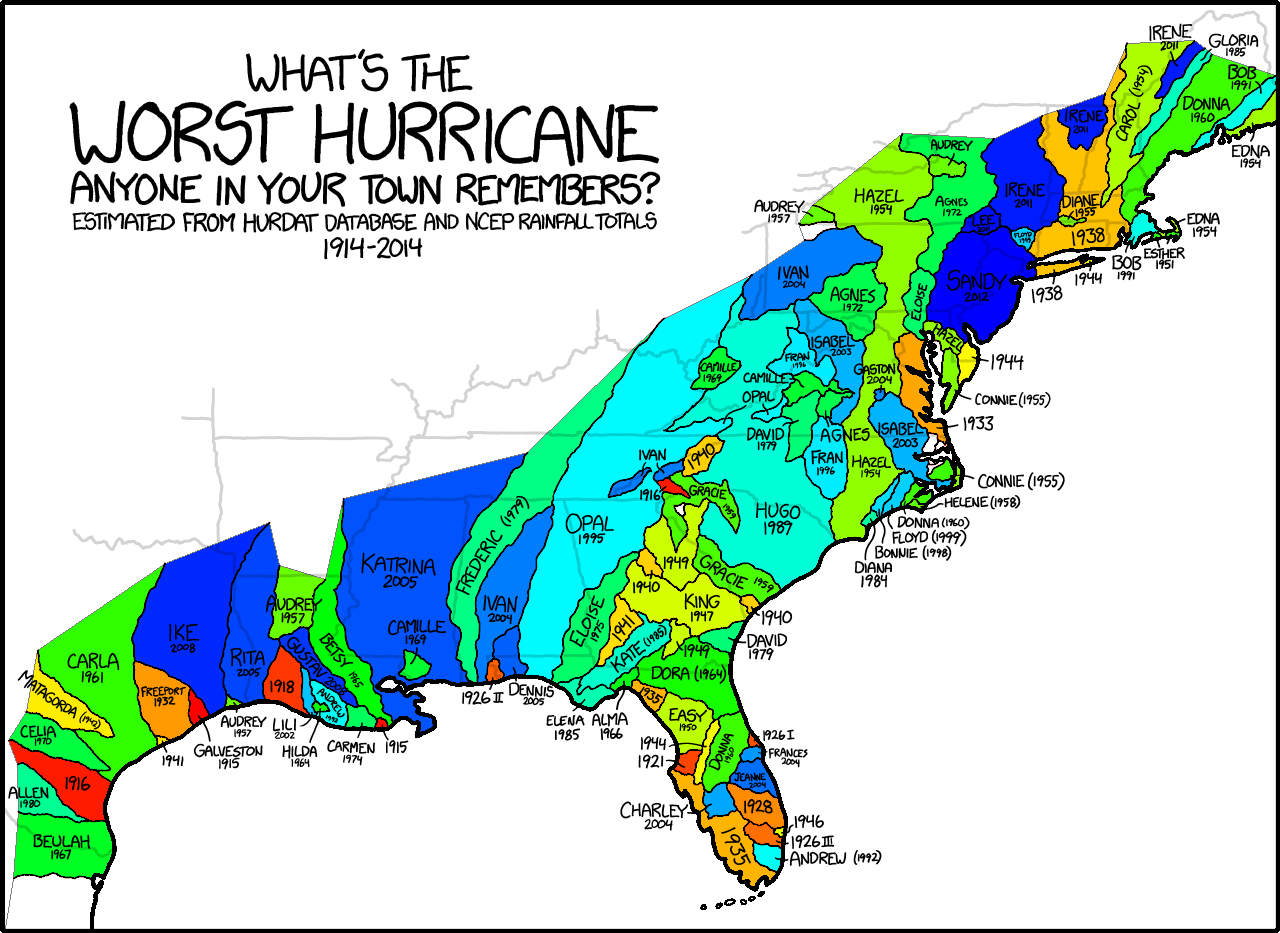
I've been nerdsniped. I've colored the map from 1407 in two different ways. First, by using the index of the hurricane in the table, from 0 to 73. Second, by finding out in what day the hurricane happened (actually used dissipation day), then by converting this date to the number of milliseconds since 1970/01/01, then by normalizing that to a 0–1 range. Both ranges where converted to a color with HSL (x, 100, 50), where x varies from red to blue, going through green. Some areas of the map remained blank because it's not stated which hurricane was most remembered there, and I'm not that interested in US geography/meteorology to find out. I used Java to parse the data and Java/GIMP to make the images.
Here's the map colored by each hurricane's dissipation date:

| Here's the data table for the date coloring |
|---|
day month year name millis normalized color 23 8 1915 Galveston -1715461200000 0.0 ff0000 30 9 1915 1915 VI -1712178000000 0.0010703936396083205 ff0100 15 7 1916 1916 IV -1687208400000 0.009211018951366336 ff0900 20 8 1916 1916 VI -1684098000000 0.01022507608362685 ff0a00 7 8 1918 1918 I -1622149200000 0.030421713967815425 ff1f00 29 10 1921 1921 VI -1520283600000 0.06363208504934725 ff4000 2 8 1926 1926 I -1370120400000 0.11258850993459096 ff7200 8 8 1926 1926 II -1369602000000 0.11275751945663438 ff7300 27 8 1926 1926 III -1367960400000 0.11329271627643854 ff7300 22 9 1926 1926 VII -1365714000000 0.11402509087196003 ff7400 18 9 1928 1928 IV -1302901200000 0.13450341129288762 ff8900 15 8 1932 Freeport -1179608400000 0.17469950928554745 ffb200 25 8 1933 1933 VI -1147208400000 0.18526260441326114 ffbc00 6 9 1935 1935 III -1083099600000 0.2061634486392973 ffd200 22 9 1938 1938 VI -987022800000 0.23748654672467762 fff200 14 8 1940 1940 III -927234000000 0.2569789782670186 f7ff00 25 9 1941 1941 II -892069200000 0.2684434575122972 ecff00 31 8 1942 Matagord -862693200000 0.27802066376142426 e2ff00 15 9 1944 1944 VII -798238800000 0.29903418100215606 ccff00 20 10 1944 1944 XII -795214800000 0.30002006988074265 cbff00 14 10 1946 1946 VI -732661200000 0.32041388554064854 b7ff00 16 10 1947 King -700952400000 0.330751634638971 acff00 1 9 1949 1949 II -641682000000 0.3500750566592686 98ff00 9 9 1950 Easy -609454800000 0.36058181527963445 8eff00 1 9 1954 Carol -483915600000 0.4015102878678158 64ff00 15 9 1954 Edna -482706000000 0.4019046434192504 64ff00 18 10 1954 Hazel -479854800000 0.40283419579048924 63ff00 15 8 1955 Connie -453848400000 0.41131284014633407 5aff00 23 8 1955 Diane -453157200000 0.4115381861757253 5aff00 29 6 1957 Audrey -394750800000 0.4305799256592838 46ff00 29 9 1958 Helene -355266000000 0.4434528175882576 39ff00 30 9 1959 Gracie -323643600000 0.45376239843290617 2fff00 14 9 1960 Donna -293403600000 0.46362128721877227 25ff00 17 9 1961 Carla -261608400000 0.47398720457076865 1aff00 27 9 1961 Esther -260744400000 0.47426888710750764 1aff00 14 9 1964 Dora -167173200000 0.5047751058363448 00ff04 5 10 1964 Hilda -165358800000 0.5053666391634968 00ff05 13 9 1965 Betsy -135723600000 0.5150283501736456 00ff0f 13 6 1966 Alma -112136400000 0.5227182834266211 00ff17 22 9 1967 Beulah -71874000000 0.5358446896386599 00ff24 22 8 1969 Camille -11394000000 0.5555624672103922 00ff38 5 8 1970 Celia 18673200000 0.5653650194889105 00ff42 23 6 1972 Agnes 78116400000 0.5847447780165559 00ff56 10 9 1974 Carmen 148014000000 0.6075328952387435 00ff6d 24 9 1975 Eloise 180759600000 0.6182086633811529 00ff78 8 9 1979 David 305607600000 0.6589117899399429 00ffa2 15 9 1979 Frederic 306212400000 0.6591089677156603 00ffa2 11 8 1980 Allen 334810800000 0.6684326596817222 00ffab 16 9 1984 Diana 464151600000 0.7106005354315552 00ffd6 4 9 1985 Elena 494650800000 0.7205439289784431 00ffe0 2 10 1985 Gloria 497070000000 0.7213326400813124 00ffe1 23 11 1985 Kate 501559200000 0.7227962155951189 00ffe3 25 9 1989 Hugo 622695600000 0.7622892809231676 00f2ff 20 8 1991 Bob 682657200000 0.7818380489728564 00deff 28 8 1992 Andrew 714970800000 0.7923729758468961 00d3ff 5 10 1995 Opal 812862000000 0.8242876072594284 00b3ff 10 9 1996 Fran 842324400000 0.8338929817622294 00a9ff 30 8 1998 Bonnie 904446000000 0.8541459561537658 0094ff 19 9 1999 Floyd 937710000000 0.8649907338182186 0089ff 8 10 2002 Lili 1034046000000 0.8963983366646205 0069ff 20 9 2003 Isabel 1064026800000 0.906172720689465 005fff 15 8 2004 Charley 1092538800000 0.915468244401853 0056ff 10 9 2004 Frances 1094785200000 0.9162006189973745 0055ff 3 9 2004 Gaston 1094180400000 0.9160034412216571 0055ff 24 9 2004 Ivan 1095994800000 0.9165949745488091 0055ff 29 9 2004 Jeanne 1096426800000 0.9167358158171787 0054ff 18 7 2005 Dennis 1121655600000 0.9249609458899584 004cff 31 8 2005 Katrina 1125457200000 0.9262003490516101 004bff 26 9 2005 Rita 1127703600000 0.9269327236471316 004aff 7 9 2008 Gustav 1220756400000 0.9572699328539253 002bff 15 9 2008 Ike 1221447600000 0.9574952788833165 002bff 30 8 2011 Irene 1314673200000 0.9878888245974581 000cff 6 9 2011 Lee 1315278000000 0.9880860023731753 000cff 2 11 2012 Sandy 1351821600000 1.0 0000ff |
Here's the map colored by each hurricane's index:

| Here's the data table for the index coloring |
|---|
day month year name normalized position color 23 8 1915 Galveston 0.0 ff0000 30 9 1915 1915 VI 0.0136986301369863 ff0100 15 7 1916 1916 IV 0.0273972602739726 ff0900 20 8 1916 1916 VI 0.0410958904109589 ff0a00 7 8 1918 1918 I 0.0547945205479452 ff1f00 29 10 1921 1921 VI 0.0684931506849315 ff4000 2 8 1926 1926 I 0.0821917808219178 ff7200 8 8 1926 1926 II 0.0958904109589041 ff7300 27 8 1926 1926 III 0.1095890410958904 ff7300 22 9 1926 1926 VII 0.1232876712328767 ff7400 18 9 1928 1928 IV 0.136986301369863 ff8900 15 8 1932 Freeport 0.1506849315068493 ffb200 25 8 1933 1933 VI 0.1643835616438356 ffbc00 6 9 1935 1935 III 0.1780821917808219 ffd200 22 9 1938 1938 VI 0.1917808219178082 fff200 14 8 1940 1940 III 0.2054794520547945 f7ff00 25 9 1941 1941 II 0.2191780821917808 ecff00 31 8 1942 Matagorda 0.2328767123287671 e2ff00 15 9 1944 1944 VII 0.2465753424657534 ccff00 20 10 1944 1944 XIII 0.2602739726027397 cbff00 14 10 1946 1946 VI 0.273972602739726 b7ff00 16 10 1947 King 0.2876712328767123 acff00 1 9 1949 1949 II 0.3013698630136986 98ff00 9 9 1950 Easy 0.3150684931506849 8eff00 1 9 1954 Carol 0.3287671232876712 64ff00 15 9 1954 Edna 0.3424657534246575 64ff00 18 10 1954 Hazel 0.3561643835616438 63ff00 15 8 1955 Connie 0.3698630136986301 5aff00 23 8 1955 Diane 0.3835616438356164 5aff00 29 6 1957 Audrey 0.3972602739726027 46ff00 29 9 1958 Helene 0.410958904109589 39ff00 30 9 1959 Gracie 0.4246575342465753 2fff00 14 9 1960 Donna 0.4383561643835616 25ff00 17 9 1961 Carla 0.4520547945205479 1aff00 27 9 1961 Esther 0.4657534246575342 1aff00 14 9 1964 Dora 0.4794520547945205 00ff04 5 10 1964 Hilda 0.4931506849315068 00ff05 13 9 1965 Betsy 0.5068493150684932 00ff0f 13 6 1966 Alma 0.5205479452054794 00ff17 22 9 1967 Beulah 0.5342465753424658 00ff24 22 8 1969 Camille 0.547945205479452 00ff38 5 8 1970 Celia 0.5616438356164384 00ff42 23 6 1972 Agnes 0.5753424657534246 00ff56 10 9 1974 Carmen 0.589041095890411 00ff6d 24 9 1975 Eloise 0.6027397260273972 00ff78 8 9 1979 David 0.6164383561643836 00ffa2 15 9 1979 Frederic 0.6301369863013698 00ffa2 11 8 1980 Allen 0.6438356164383562 00ffab 16 9 1984 Diana 0.6575342465753424 00ffd6 4 9 1985 Elena 0.6712328767123288 00ffe0 2 10 1985 Gloria 0.684931506849315 00ffe1 23 11 1985 Kate 0.6986301369863014 00ffe3 25 9 1989 Hugo 0.7123287671232876 00f2ff 20 8 1991 Bob 0.726027397260274 00deff 28 8 1992 Andrew 0.7397260273972602 00d3ff 5 10 1995 Opal 0.7534246575342466 00b3ff 10 9 1996 Fran 0.7671232876712328 00a9ff 30 8 1998 Bonnie 0.7808219178082192 0094ff 19 9 1999 Floyd 0.7945205479452054 0089ff 8 10 2002 Lili 0.8082191780821918 0069ff 20 9 2003 Isabel 0.821917808219178 005fff 15 8 2004 Charley 0.8356164383561644 0056ff 10 9 2004 Frances 0.8493150684931506 0055ff 3 9 2004 Gaston 0.863013698630137 0055ff 24 9 2004 Ivan 0.8767123287671232 0055ff 29 9 2004 Jeanne 0.8904109589041096 0054ff 18 7 2005 Dennis 0.9041095890410958 004cff 31 8 2005 Katrina 0.9178082191780822 004bff 26 9 2005 Rita 0.9315068493150684 004aff 7 9 2008 Gustav 0.9452054794520548 002bff 15 9 2008 Ike 0.958904109589041 002bff 30 8 2011 Irene 0.9726027397260274 000cff 6 9 2011 Lee 0.9863013698630136 000cff 2 11 2012 Sandy 1.0 0000ff |
| Here's the Java code to parse the data |
|---|
 package main;

 public final class xkcd1407Hurricane {

     public int color[] = null;

     public double colorNormalizedMillis = 0;

     public double colorNormalizedPosition = 0;

     public long date = 0;

     public byte day = 0;

     public byte month = 0;

     public String name = null;

     public short year = 0;
 }
 package main;

 import java.util.GregorianCalendar;
 import java.util.LinkedList;

 public final class xkcd1407 {

     private static String fields[] = null;

     private static final LinkedList<xkcd1407Hurricane> hurricanes = new LinkedList<>();

     //<editor-fold desc="input">
     private static final String input
      = "23	8	1915	Galveston\n"
      + "30	9		1915 VI\n"
      + "15	7	1916	1916 IV\n"
      + "20	8		1916 VI\n"
      + "7	8	1918	1918 I\n"
      + "29	10	1921	1921 VI\n"
      + "2	8	1926	1926 I\n"
      + "8	8		1926 II\n"
      + "27	8		1926 III\n"
      + "22	9		1926 VII\n"
      + "18	9	1928	1928 IV\n"
      + "15	8	1932	Freeport\n"
      + "25	8	1933	1933 VI\n"
      + "6	9	1935	1935 III\n"
      + "22	9	1938	1938 VI\n"
      + "14	8	1940	1940 III\n"
      + "25	9	1941	1941 II\n"
      + "31	8	1942	Matagorda\n"
      + "15	9	1944	1944 VII\n"
      + "20	10		1944 XIII\n"
      + "14	10	1946	1946 VI\n"
      + "16	10	1947	King\n"
      + "1	9	1949	1949 II\n"
      + "9	9	1950	Easy\n"
      + "1	9	1954	Carol\n"
      + "15	9		Edna\n"
      + "18	10		Hazel\n"
      + "15	8	1955	Connie\n"
      + "23	8		Diane\n"
      + "29	6	1957	Audrey\n"
      + "29	9	1958	Helene\n"
      + "30	9	1959	Gracie\n"
      + "14	9	1960	Donna\n"
      + "17	9	1961	Carla\n"
      + "27	9		Esther\n"
      + "14	9	1964	Dora\n"
      + "5	10		Hilda\n"
      + "13	9	1965	Betsy\n"
      + "13	6	1966	Alma\n"
      + "22	9	1967	Beulah\n"
      + "22	8	1969	Camille\n"
      + "5	8	1970	Celia\n"
      + "23	6	1972	Agnes\n"
      + "10	9	1974	Carmen\n"
      + "24	9	1975	Eloise\n"
      + "8	9	1979	David\n"
      + "15	9		Frederic\n"
      + "11	8	1980	Allen\n"
      + "16	9	1984	Diana\n"
      + "4	9	1985	Elena\n"
      + "2	10		Gloria\n"
      + "23	11		Kate\n"
      + "25	9	1989	Hugo\n"
      + "20	8	1991	Bob\n"
      + "28	8	1992	Andrew\n"
      + "5	10	1995	Opal\n"
      + "10	9	1996	Fran\n"
      + "30	8	1998	Bonnie\n"
      + "19	9	1999	Floyd\n"
      + "8	10	2002	Lili\n"
      + "20	9	2003	Isabel\n"
      + "15	8	2004	Charley\n"
      + "10	9		Frances\n"
      + "3	9		Gaston\n"
      + "24	9		Ivan\n"
      + "29	9		Jeanne\n"
      + "18	7	2005	Dennis\n"
      + "31	8		Katrina\n"
      + "26	9		Rita\n"
      + "7	9	2008	Gustav\n"
      + "15	9		Ike\n"
      + "30	8	2011	Irene\n"
      + "6	9		Lee\n"
      + "2	11	2012	Sandy";
     //</editor-fold>

     public static int[] percentageToColor (double percentage) {
         int color[] = new int[]{255, 0, 0};
         if ((percentage > 0) && (percentage < 0.25)) {
             color[0] = 255;
             color[1] = (int) (255 * (percentage * 4.0));
             color[2] = 0;
         } else if (percentage == 0.25) {
             color[0] = 255;
             color[1] = 255;
             color[2] = 0;
         } else if ((percentage > 0.25) && (percentage < 0.5)) {
             color[0] = (int) (255 * ((percentage * (-4.0)) + 2));
             color[1] = 255;
             color[2] = 0;
         } else if (percentage == 0.5) {
             color[0] = 0;
             color[1] = 255;
             color[2] = 0;
         } else if ((percentage > 0.5) && (percentage < 0.75)) {
             color[0] = 0;
             color[1] = 255;
             color[2] = (int) (255 * ((percentage * 4.0) - 2));
         } else if (percentage == 0.75) {
             color[0] = 0;
             color[1] = 255;
             color[2] = 255;
         } else if ((percentage > 0.75) && (percentage < 1)) {
             color[0] = 0;
             color[1] = (int) (255 * ((percentage * (-4.0)) + 4));
             color[2] = 255;
         } else if (percentage == 1) {
             color[0] = 0;
             color[1] = 0;
             color[2] = 255;
         }
         return color;
     }

     public static void main (String args[]) throws IOException {
         {
             xkcd1407Hurricane hurricane = null;
             short lastYear = 0;
             for (String sI : input.split("\n")) {
                 fields = sI.split("\t");
                 hurricane = new xkcd1407Hurricane();
                 hurricane.day = Byte.parseByte(fields[0]);
                 hurricane.month = Byte.parseByte(fields[1]);
                 try {
                     hurricane.year = Short.parseShort(fields[2]);
                     lastYear = hurricane.year;
                 } catch (NumberFormatException ex) {
                     hurricane.year = lastYear;
                 }
                 hurricane.name = fields[3];
                 hurricane.date = new GregorianCalendar(hurricane.year, hurricane.month - 1, hurricane.day).getTimeInMillis();
                 hurricanes.add(hurricane);
             }
         }
         for (int i = 0; i < hurricanes.size(); i++) {
             hurricanes.get(i).colorNormalizedMillis
              = ((double) (hurricanes.get(i).date - hurricanes.getFirst().date))
              / ((double) (hurricanes.getLast().date - hurricanes.getFirst().date));
             hurricanes.get(i).colorNormalizedPosition
              = ((double) i) / ((double) hurricanes.size() - 1);
             hurricanes.get(i).color = percentageToColor(hurricanes.get(i).colorNormalizedMillis);
             //hurricanes.get(i).color = percentageToColor(hurricanes.get(i).colorNormalizedPosition);
         }
         for (xkcd1407Hurricane hI : hurricanes) {
             System.out.format("  " + hI.day + "\t" + hI.month + "\t" + hI.year + "\t" + hI.name + "\t\t" + hI.date + "\t" + hI.colorNormalizedMillis + "\t%02x%02x%02x\n", hI.color[0], hI.color[1], hI.color[2]);
             //System.out.format("  " + hI.day + "\t" + hI.month + "\t" + hI.year + "\t" + hI.name + "\t\t" + hI.colorNormalizedPosition + "\t%02x%02x%02x\n", hI.color[0], hI.color[1], hI.color[2]);
         }
     }
 }
|
| Here's the Java code to treat the image |
|---|
 package main;

 import java.awt.image.BufferedImage;
 import java.awt.image.WritableRaster;
 import java.io.File;
 import java.io.IOException;
 import javax.imageio.ImageIO;

 @SuppressWarnings("Convert2Lambda")
 public final class Main {

     private static int color[] = null;

     public static void main(String args[]) throws IOException {
         BufferedImage input = ImageIO.read(new File("C:\\Users\\GuiR\\Desktop\\worst_hurricane_large.png"));
         WritableRaster raster = input.getRaster();
         for (int y = 0; y < input.getHeight(); y++) {
             for (int x = 0; x < input.getWidth(); x++) {
                 color = raster.getPixel(x, y, (int[]) null);
                 //if ((color[0] != color[1]) || (color[1] != color[2]) || (color[0] != color[2])) {// it's red
                 if ((color[0] == color[1]) && (color[1] == color[2])) {// it's not red
                     color[0] = 255;
                     color[1] = 255;
                     color[2] = 255;
                 }
                 raster.setPixel(x, y, color);
             }
         }
         //ImageIO.write(input, "png", new File("C:\\Users\\GuiR\\Desktop\\worst_hurricane_large_black.png"));
         ImageIO.write(input, "png", new File("C:\\Users\\GuiR\\Desktop\\worst_hurricane_large_red.png"));
     }
 }
|
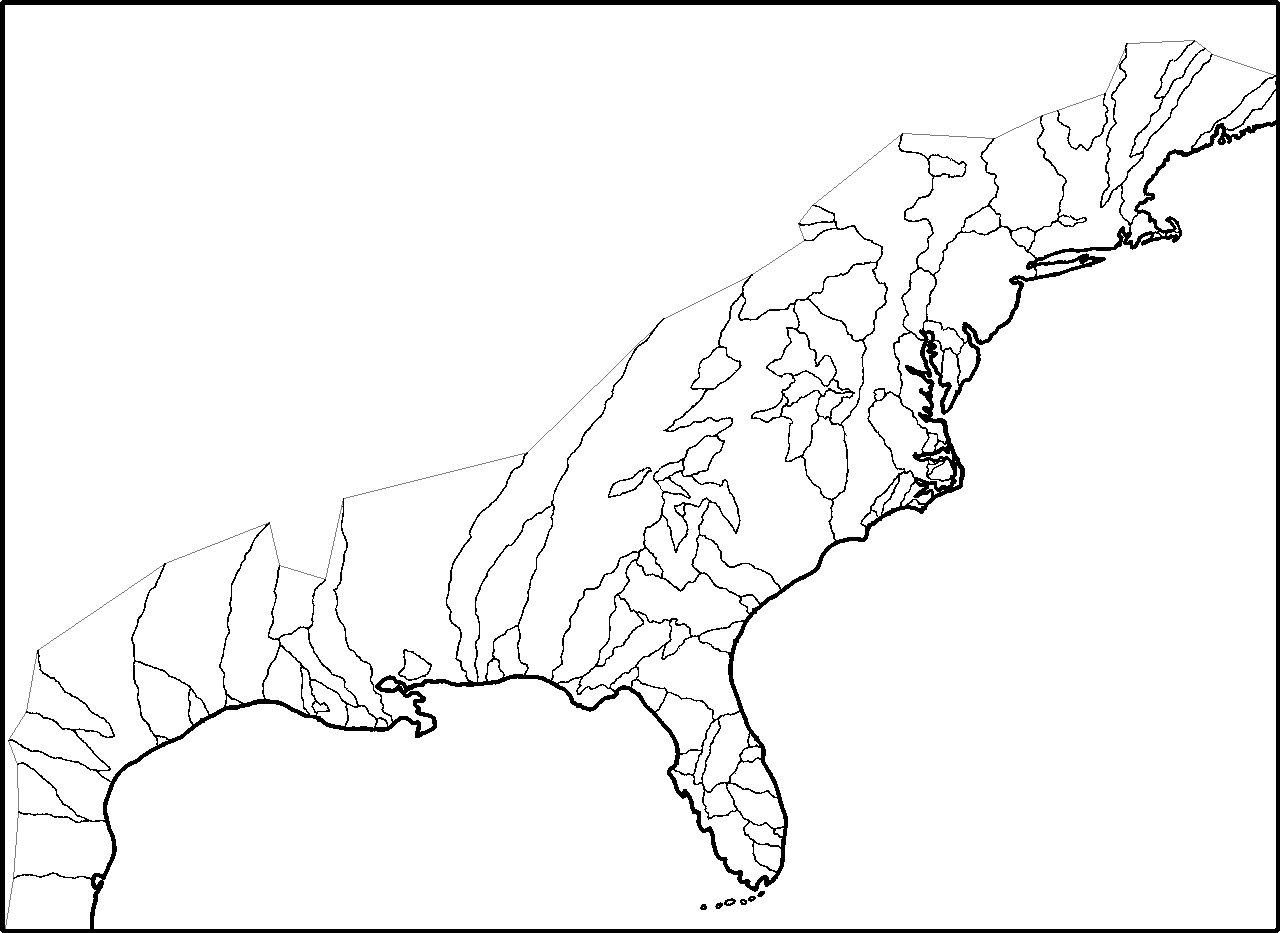
I just used it to separate the red lines from the black lines.
| Here's the image I used to color the areas. Add the original image on top and set it to multiply. |
|---|
I was going to add the GIMP xcf image, but this wiki doesn't allow it.

