2918: Tick Marks
| Tick Marks |
 Title text: If you're really savvy, you can hide an entire set of illicit transactions by timing them to draw what looks like a graph inset. |
Explanation
| |
This explanation may be incomplete or incorrect: Created by a BOT WORKING IN SECRET - Please change this comment when editing this page. Do NOT delete this tag too soon. If you can address this issue, please edit the page! Thanks. |
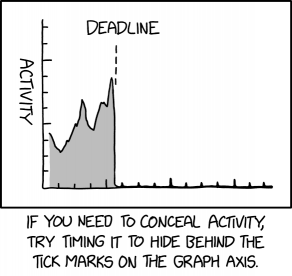
This comic provides the reader with a suggestion on how to "conceal activity" that is going to be graphed over time; by timing bursts of activity with the ticks on the time axis. This is assuming that the scale of the time axis is known, and that the "bottom" of the graph coincides with the line on which the ticks are drawn, rather than the "peak" of the largest tick.
Theoretically, the graphed "activity" would be concealed behind the ticks, meaning anyone reading the graph would perceive activity as having ceased at the deadline, even though it had continued in time-axis-tick-sized bursts afterwards.
Transcript
- [A graph with two axis is shown. Both axis have tick marks with every fourth a bit longer than those in between. The Y-axis is labeled with text turned 90 degrees down. There is no label on the X-axis. The graph is a jagged curve with three clear peaks and the area beneath the curve is shaded in light fray. After the third and highest peak the curve drops to zero. At the point of decline, a dotted line goes up to a label above the last peak. The X-axis and the ticks on it to the right of this dotted line is clearly thicker than the axis and the ticks to the left. This continues till the end with the first four ticks normal and the last ten ticks thicker.]
- Y-axis: Activity
- Label: Deadline
- [Caption beneath the panel:]
- If you need to conceal activity, try timing it to hide behind the tick marks on the graph axis.
Discussion
The ticks on the y axis conceal the area of the graph between them. Why didn't Randall just build his graph so that the x axis did similar? Then he could keep up a continuous level of activity equal to the size of the ticks, rather than just doing short bursts to coincide with them.172.70.91.146 09:28, 11 April 2024 (UTC)
- Don't really know. But look, I was waiting all day yesterday for the Wednesday comic, so I'll take any comic at this point T_T Z1mp0st0rz (talk) 14:54, 11 April 2024 (UTC)
- It was at least half an hour before end-of-day-Midnight, for Randall's expected TZ. I know you're a new username, so perhaps you weren't aware that he often publishes (as best as we can pick up) quite late in the respective day (currently UTC+6). And it's also really not so much unknown to be (fairly) early in the following day (yet still officially on the relevent M/W/F).
- That doesn't mean we aren't often frustratingly gripped by antici.................pation, but we are very rarely stymied for more than a whole day (developmental delays to rolling out 'special comics', aside), and I think we are lucky to have such a conscientious creator as we do. It must be a hard schedule to keep up with. (And also that even if "not every one is a winner", most still are, for most people. Could be worse!) 172.71.178.110 15:12, 11 April 2024 (UTC)
- I remember back a decade ago when it wasn't as much a T-T-S-evening update schedule as it is now, it's progressed over time. Poor sod might well be winding down, and regretting the busy schedule over so many bloody years. (Posting from Australia) 172.69.60.201 19:13, 12 April 2024 (UTC)
Should 688: Self-Description also be linked as an example of "actual data is part of the graphical framing device"? 172.70.39.12 21:01, 11 April 2024 (UTC)
- It already is linked, in the prior paragraph, and isn't quite so relevent to the flag-based variation (which is a kind of cousin to this tricky graph thing). But do rewrite it if you think it can be expounded better. 172.70.90.173 22:13, 11 April 2024 (UTC)
- Thanks, I must have missed it on my first read. 172.70.114.146 23:20, 11 April 2024 (UTC)
This doesn't seem like a useful method of hiding activity, simply as the area hidden under the ticks is too little to be of significance.172.69.134.16 04:09, 12 April 2024 (UTC)
What exactly is this graph meant to refer to? Obviously it's not important for the joke, but I don't really understand the premise. Is there a real-world context where "activity" of some sort is commonly reported in a line graph like this? 162.158.158.68 05:06, 12 April 2024 (UTC)
- Some sort of code repository comes to mind. Elektrizikekswerk (talk) 09:17, 12 April 2024 (UTC)
- For certain financial events, you may not be allowed to do deals within a certain time leading up to a scheduled relevent corporate disclosure. Sneaking a few microtransactions in after that time could be significantly profitable. And actionable.. 172.69.194.165 10:27, 12 April 2024 (UTC)
- It reminded me of a burnup chart, though those are intended to be cumulative, rather than distributive.172.71.242.188 08:57, 15 April 2024 (UTC)
