Difference between revisions of "Talk:2701: Change in Slope"
(→Raw Data: new section) |
|||
| Line 23: | Line 23: | ||
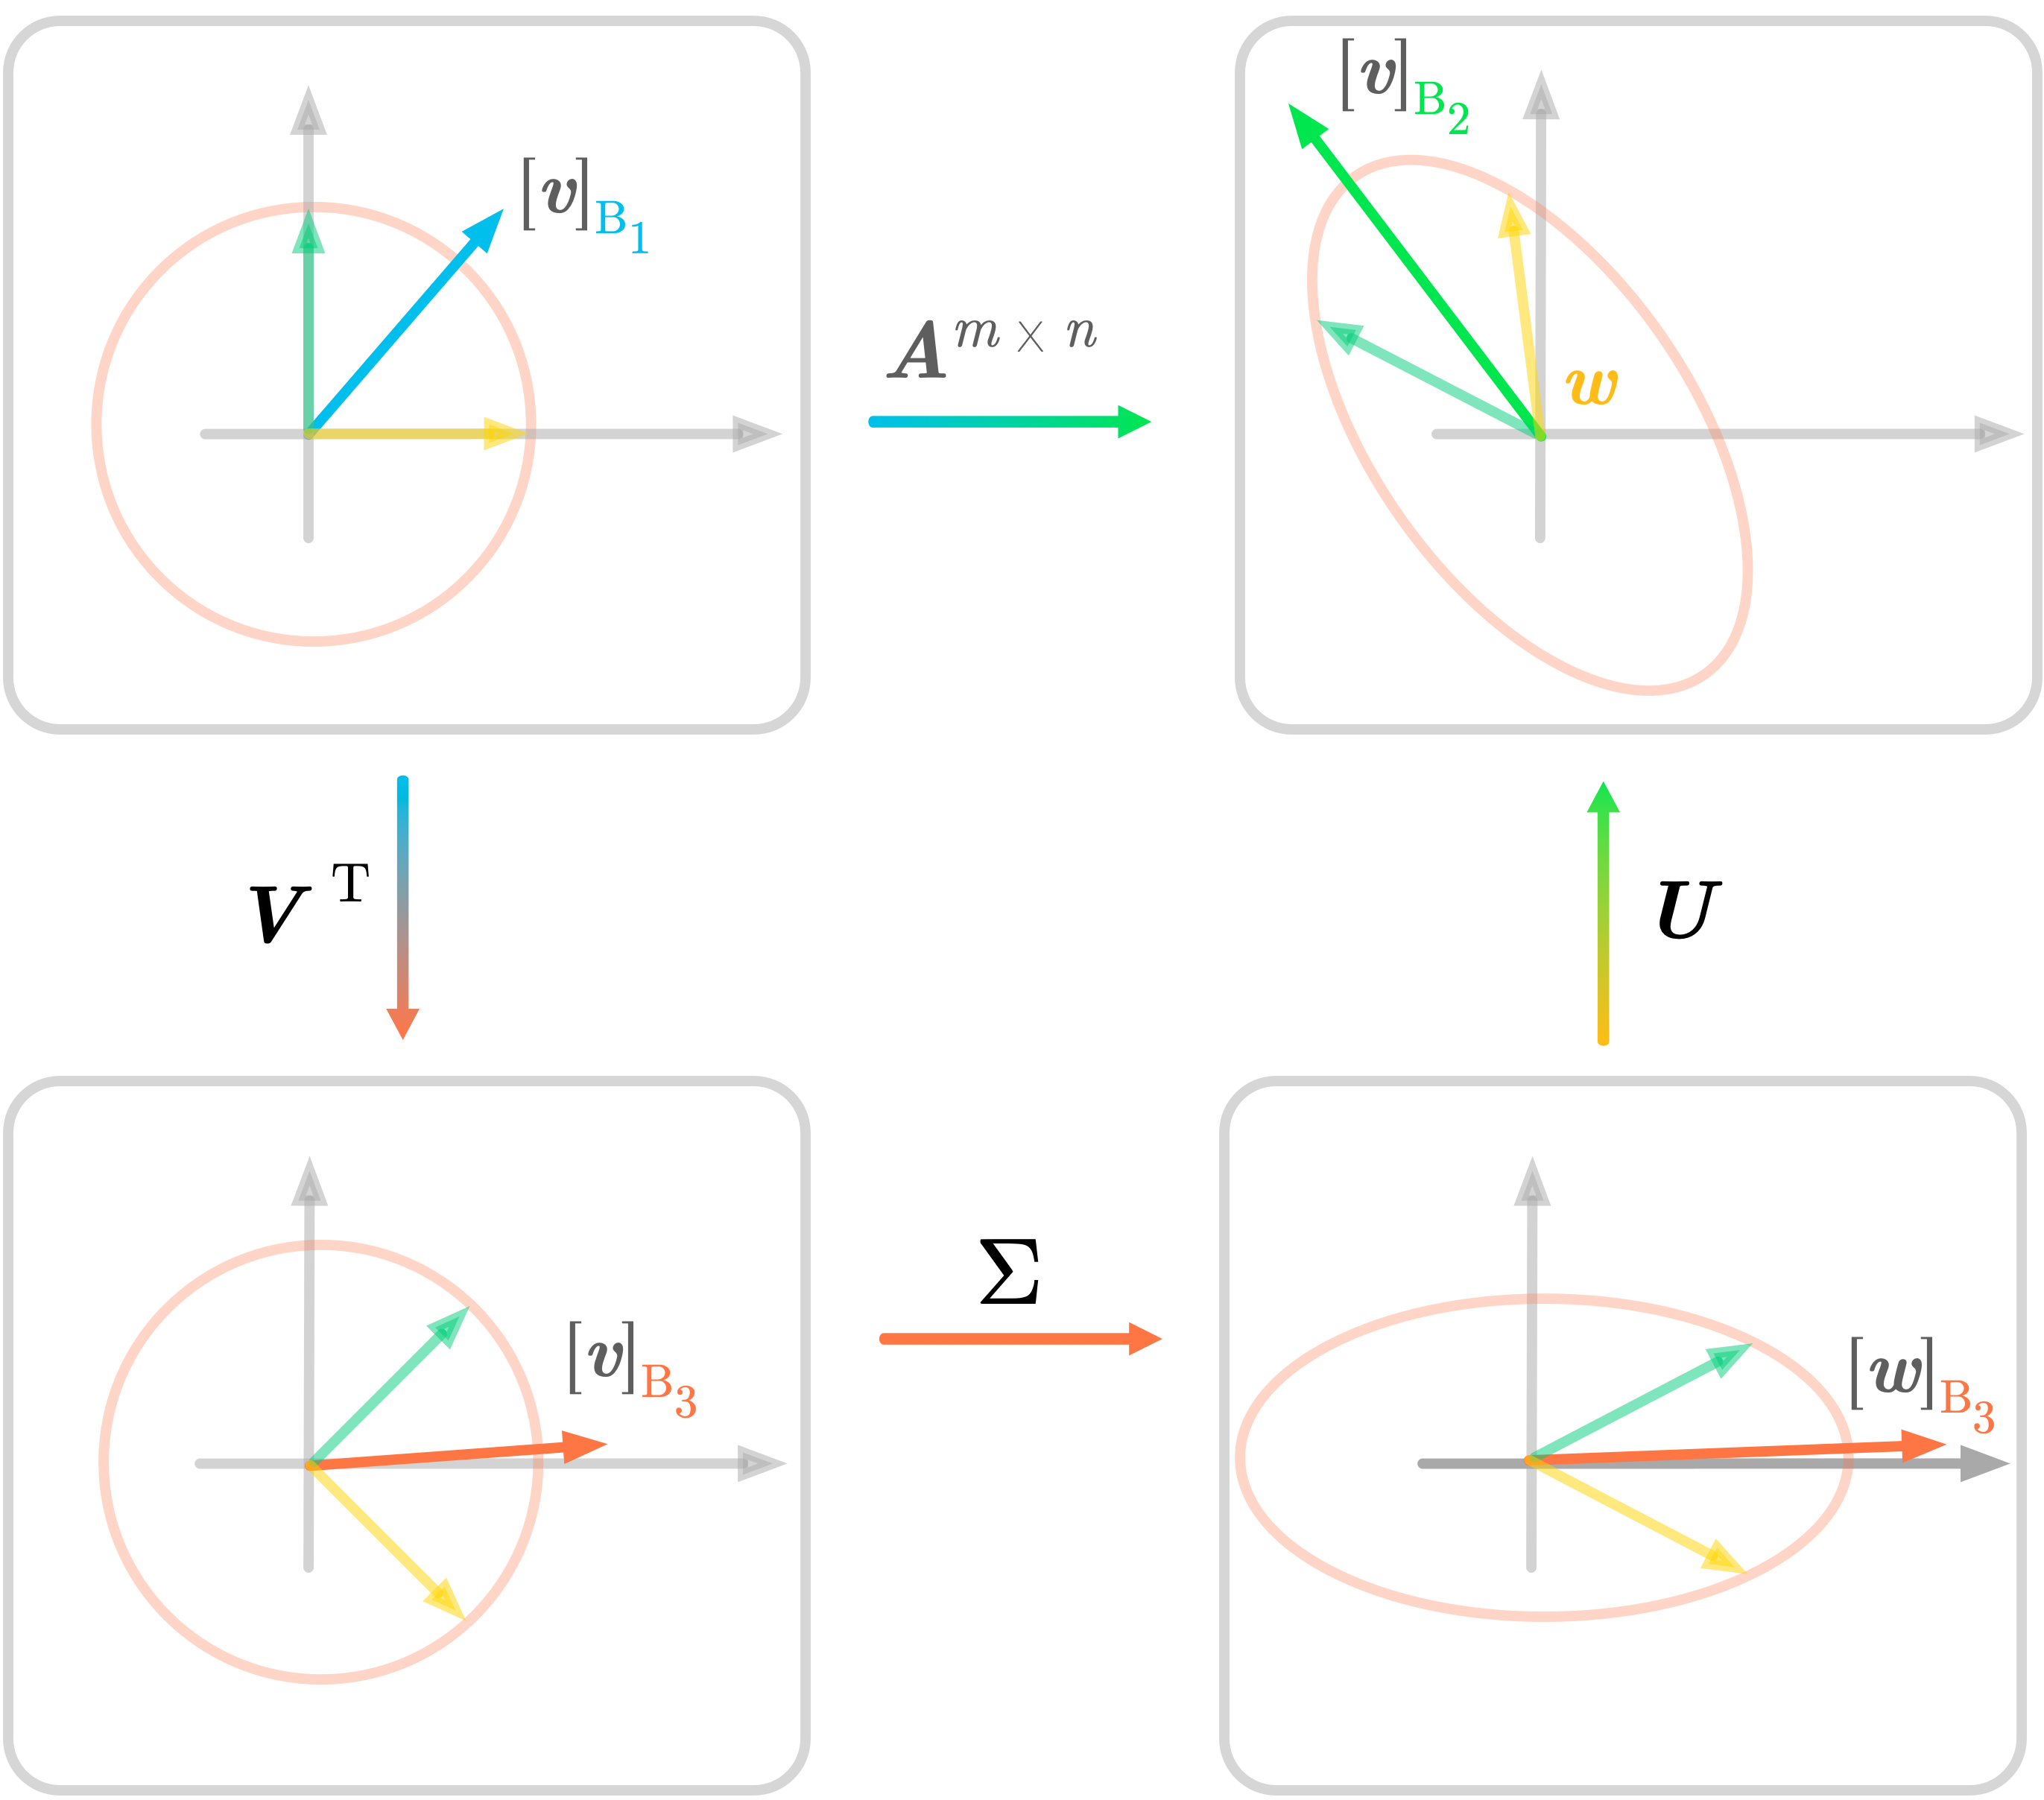
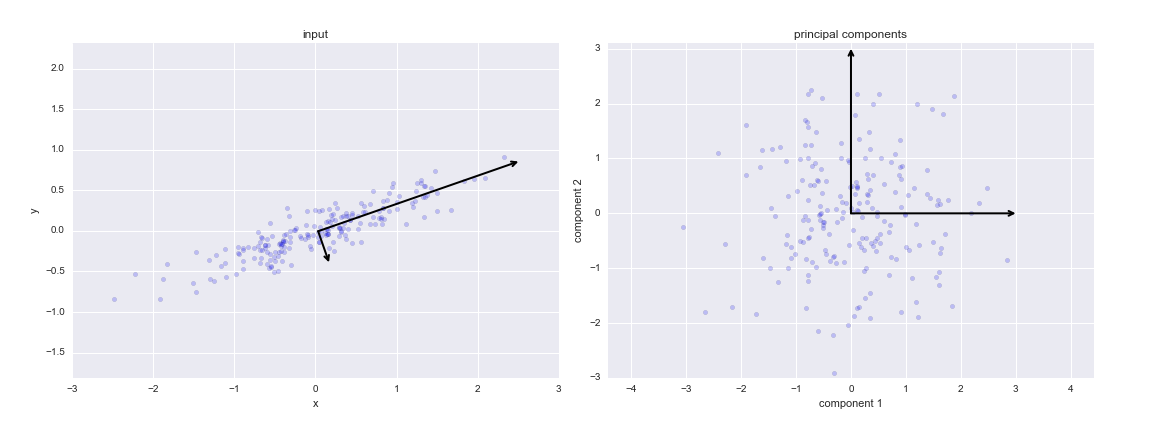
Going in a different direction than "this is silly" - if we ignore the "viewing point/parallax" issue, doing a change of basis like this is similar to linear methods like [SVD https://hadrienj.github.io/assets/images/ch12_svd/ch11_SVD_geometry.png] & [https://jakevdp.github.io/PythonDataScienceHandbook/figures/05.09-PCA-rotation.png PCA], and considering the graph as a mappingg in a "higher dimension" is similar to the "kernel trick" popularized by [https://i.ytimg.com/vi/wqSTBCguVyU/maxresdefault.jpg Support] [https://miro.medium.com/max/4800/1*gtF6KeL7b9zNHd7pXtC1Nw.png Vector] [https://dinhanhthi.com/img/post/ML/support-vector-machine/svm-3.jpg Machines] 11:31, 22 November 2022 (UTC) | Going in a different direction than "this is silly" - if we ignore the "viewing point/parallax" issue, doing a change of basis like this is similar to linear methods like [SVD https://hadrienj.github.io/assets/images/ch12_svd/ch11_SVD_geometry.png] & [https://jakevdp.github.io/PythonDataScienceHandbook/figures/05.09-PCA-rotation.png PCA], and considering the graph as a mappingg in a "higher dimension" is similar to the "kernel trick" popularized by [https://i.ytimg.com/vi/wqSTBCguVyU/maxresdefault.jpg Support] [https://miro.medium.com/max/4800/1*gtF6KeL7b9zNHd7pXtC1Nw.png Vector] [https://dinhanhthi.com/img/post/ML/support-vector-machine/svm-3.jpg Machines] 11:31, 22 November 2022 (UTC) | ||
| + | |||
| + | == Raw Data == | ||
| + | |||
| + | I love this cartoon. This is definitely something that was relevant in my work! | ||
| + | |||
| + | At my old job I had some commercial or public-domain software for extracting the raw data behind a scatter plot. If anyone has something like that handy, I would love to see someone extract the data behind the graph on the left, so that we can: | ||
| + | 1. Apply the affine transformation which generates the image on the right with the tilted paper. | ||
| + | 2. Apply the statistical tests which Randall Munroe is alluding to. | ||
Revision as of 16:52, 22 November 2022
I am an occasional data scientist, and I can confirm this is why we have monitor stands that tilt. 172.71.94.50 16:33, 21 November 2022 (UTC)
The third e in "neeed" in the title text seems to be a typo Victor (talk) 16:41, 21 November 2022 (UTC)
- I think Randall may have added it to represent that the speaker prolongs the "e" sound for emphasis, although that's usually done with 4-5 e's. Barmar (talk) 16:53, 21 November 2022 (UTC)
- I had to double-check this, myself (presumed the 'Bot created the lage faithfully, but went straight to source to see if I needed to find a vandalism post to revert). May need a comment (to prevent hypercorrection, if not to note the implied emphisis) and certainly will if it turns out to be a typo and gets corrected (for which I'm sure a future checker will discover Randall's revisiting, but then worth a note to that effect). 172.70.90.2 17:42, 21 November 2022 (UTC)
Bender Bot was one of the main characters in Futurama. Barmar (talk) 16:54, 21 November 2022 (UTC)
- Just donning my unnecessary pedantry hat for a moment: his name is Bender Bending Rodriguez --192·168·0·1 (talk) 23:02, 21 November 2022 (UTC)
A couple(?) of authors used the word(s) "(point of) inflection", which is not really suitable for a join between two straight segments. Was tempted to talk about "discontinuity", but that really only applies to the meta-slope (derivatives, to one degree or other) where it suddenly jumps (at a point), or the derivative's derivative has jumps (as it enters and leaves the smoothly linking curve). Hope it works well enough how I left it, though. 162.158.142.176 21:28, 21 November 2022 (UTC)
For anyone curious, I used an image editor to turn the entire comic sideways and it actually does seem to work, to some degree anyway. SSM24 23:37, 21 November 2022 (UTC)
- Added; thanks! 172.71.158.230 00:14, 22 November 2022 (UTC)
This one shows the beauty of Explainxkcd: people reading the explanation are likely to learn accessible methods of substantial practical utility. 162.158.166.173 00:38, 22 November 2022 (UTC)
Hey, if it works for picking out lumber at Lowe’s, why not for graphs, too? - MadMarie
- There was an old bit of explanation that related it to examining physical objects (for dent/bend-removal in metalwork, I think it was) that got wiped out by a later edit. Though I'm considering my own version, now generalised to cover your experience, as it seems quite relevant/analogous to me. 172.70.90.2 14:37, 22 November 2022 (UTC)
Whoever wrote the 1st explanation needs to go touch grass and learn how real people talk, pissed me off so much I just effectively rewrote the whole thing from scratch 172.71.202.46 06:34, 22 November 2022 (UTC)
Going in a different direction than "this is silly" - if we ignore the "viewing point/parallax" issue, doing a change of basis like this is similar to linear methods like [SVD https://hadrienj.github.io/assets/images/ch12_svd/ch11_SVD_geometry.png] & PCA, and considering the graph as a mappingg in a "higher dimension" is similar to the "kernel trick" popularized by Support Vector Machines 11:31, 22 November 2022 (UTC)
Raw Data
I love this cartoon. This is definitely something that was relevant in my work!
At my old job I had some commercial or public-domain software for extracting the raw data behind a scatter plot. If anyone has something like that handy, I would love to see someone extract the data behind the graph on the left, so that we can:
  1. Apply the affine transformation which generates the image on the right with the tilted paper.
  2. Apply the statistical tests which Randall Munroe is alluding to.
