Difference between revisions of "File:XvsC.png"
Liv2splain (talk | contribs) (Liv2splain uploaded a new version of File:XvsC.png) |
Liv2splain (talk | contribs) (Liv2splain uploaded a new version of File:XvsC.png) |
(No difference)
| |
Revision as of 07:57, 24 October 2024
Re 3001: Temperature Scales, chart showing the relationship between the °X and °C temperature scales.
File history
Click on a date/time to view the file as it appeared at that time.
| Date/Time | Thumbnail | Dimensions | User | Comment | |
|---|---|---|---|---|---|
| current | 07:57, 24 October 2024 | 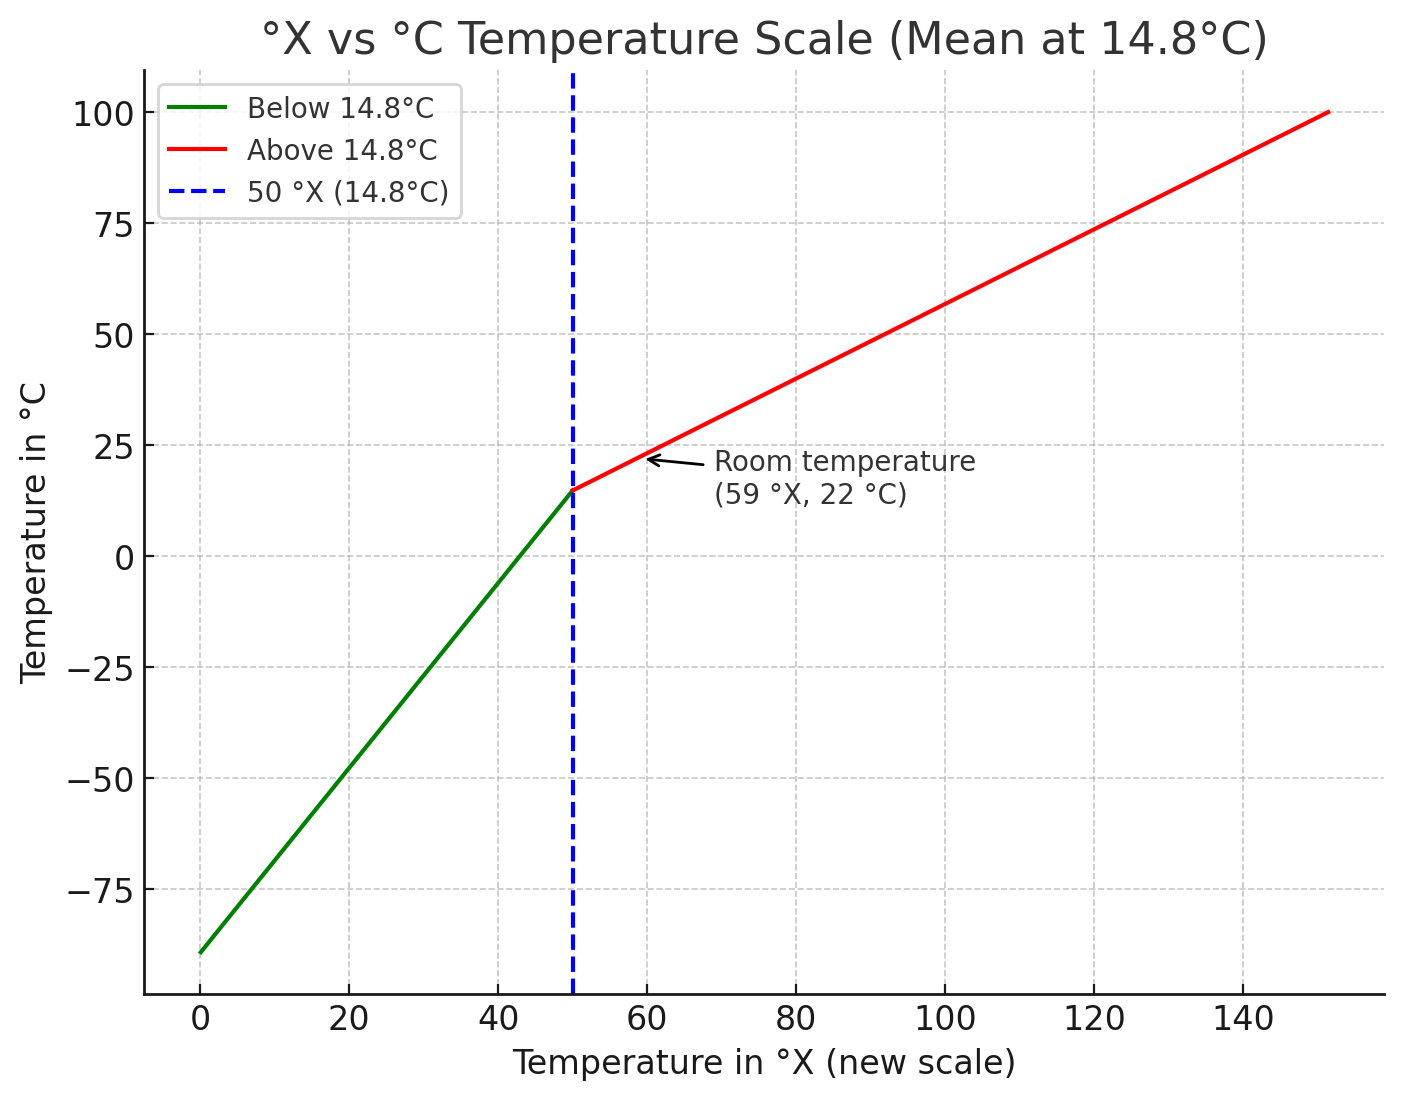 | 1,404 × 1,101 (118 KB) | Liv2splain (talk | contribs) | include the boiling point of water |
| 22:16, 23 October 2024 | 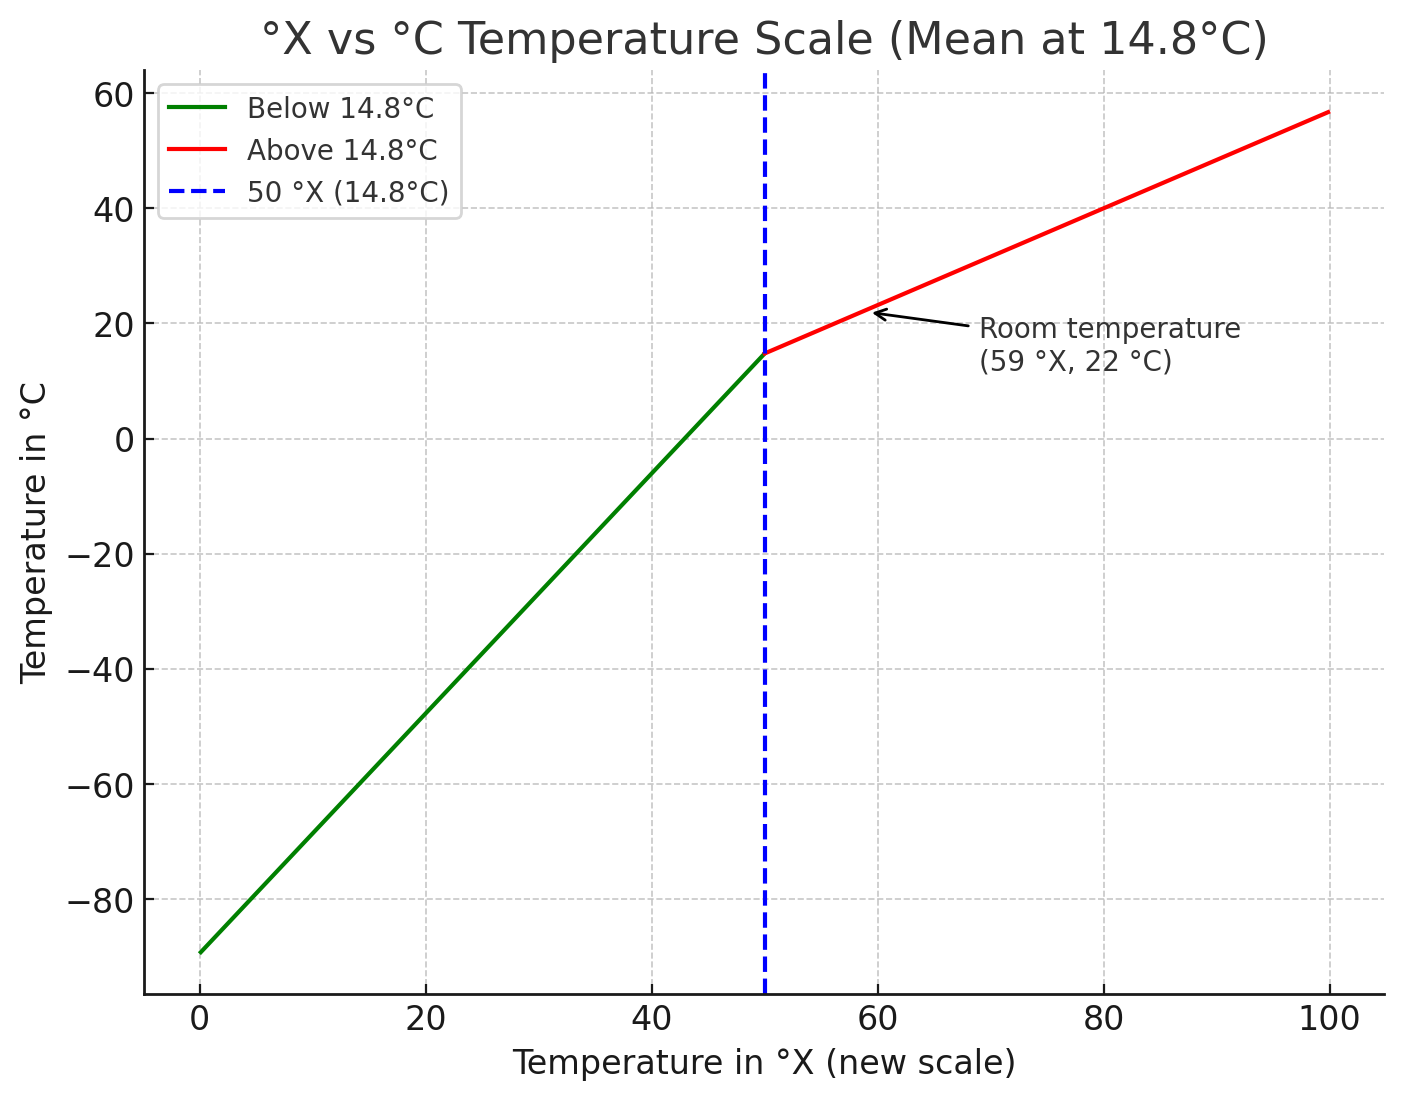 | 1,404 × 1,101 (119 KB) | Liv2splain (talk | contribs) | Room temperature is 59 after corrections | |
| 22:08, 23 October 2024 | 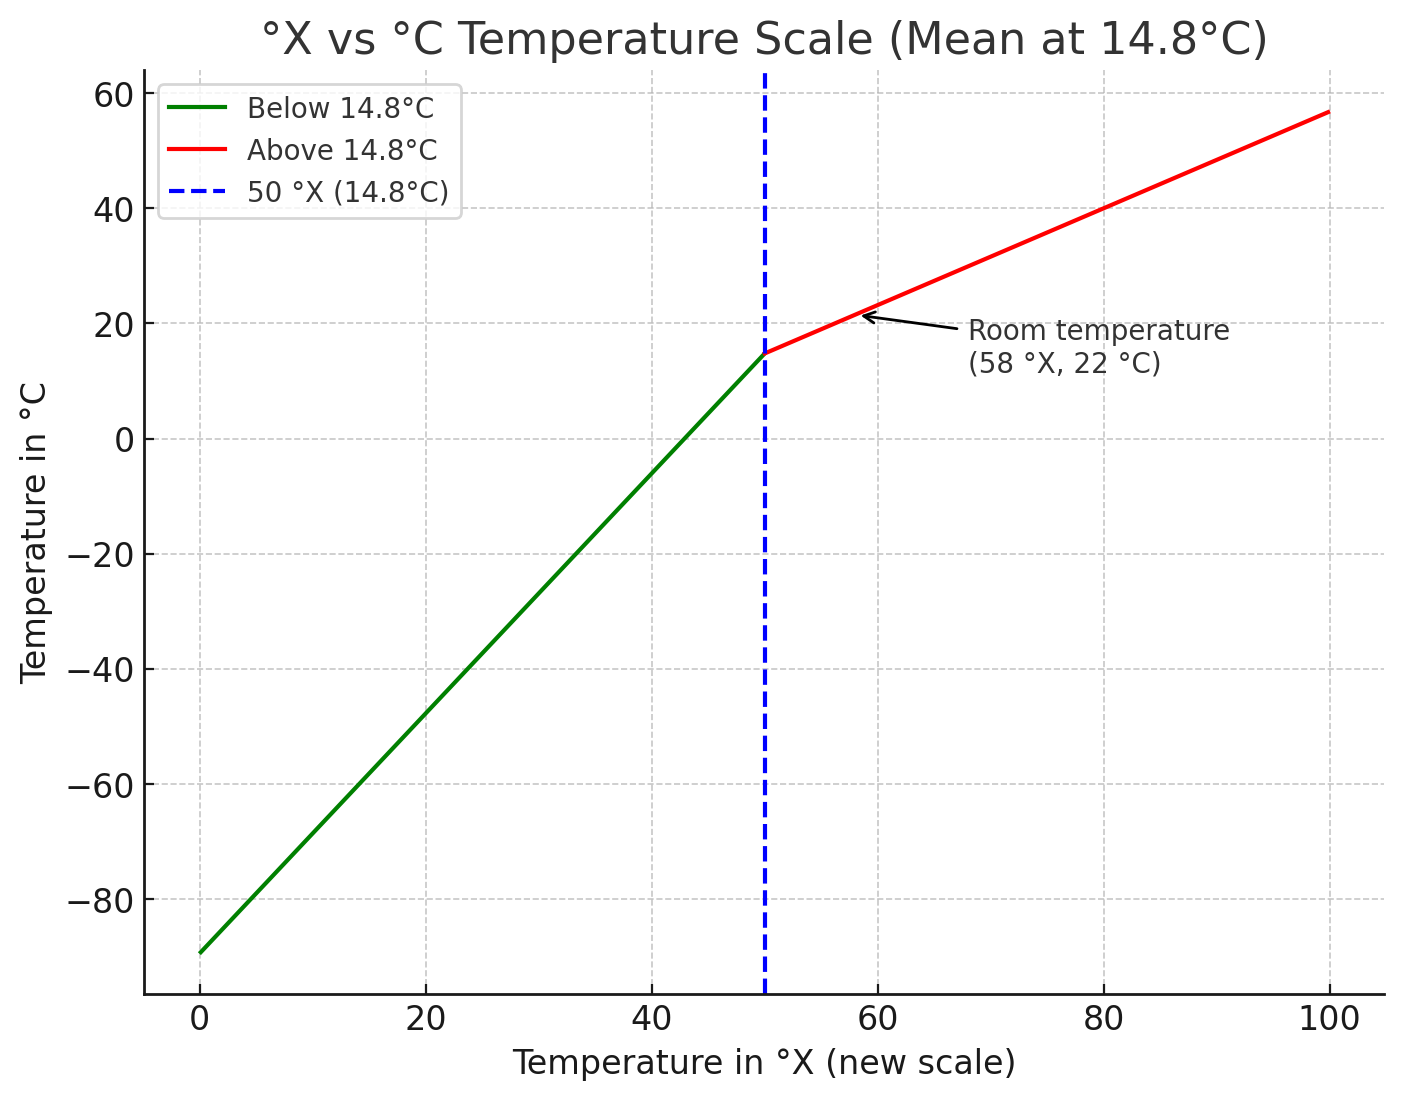 | 1,404 × 1,101 (119 KB) | Liv2splain (talk | contribs) | According to https://climate.copernicus.eu/climate-indicators/temperature the global average near-surface temperature in 2023 was 14.4 + 0.4 = 14.8°C. (see Figure 1 and click "Increase above: [1991–2020 reference period].") | |
| 08:02, 22 October 2024 | 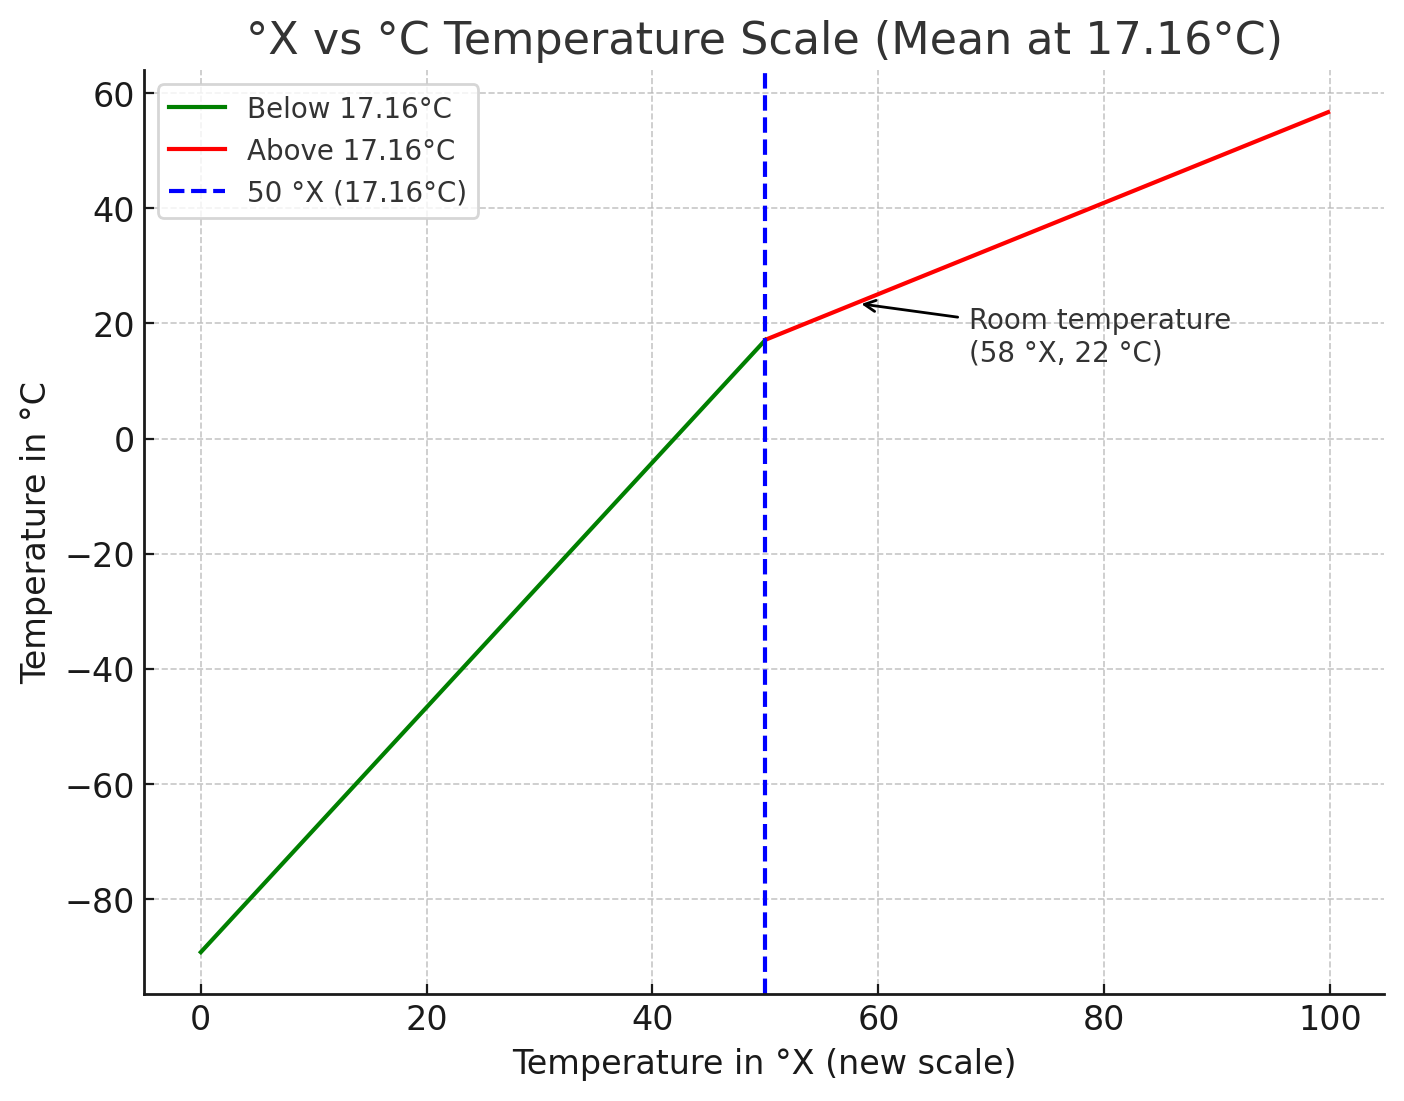 | 1,404 × 1,101 (121 KB) | Liv2splain (talk | contribs) | Correct to 17.16°C mean surface temperature. | |
| 06:52, 22 October 2024 | 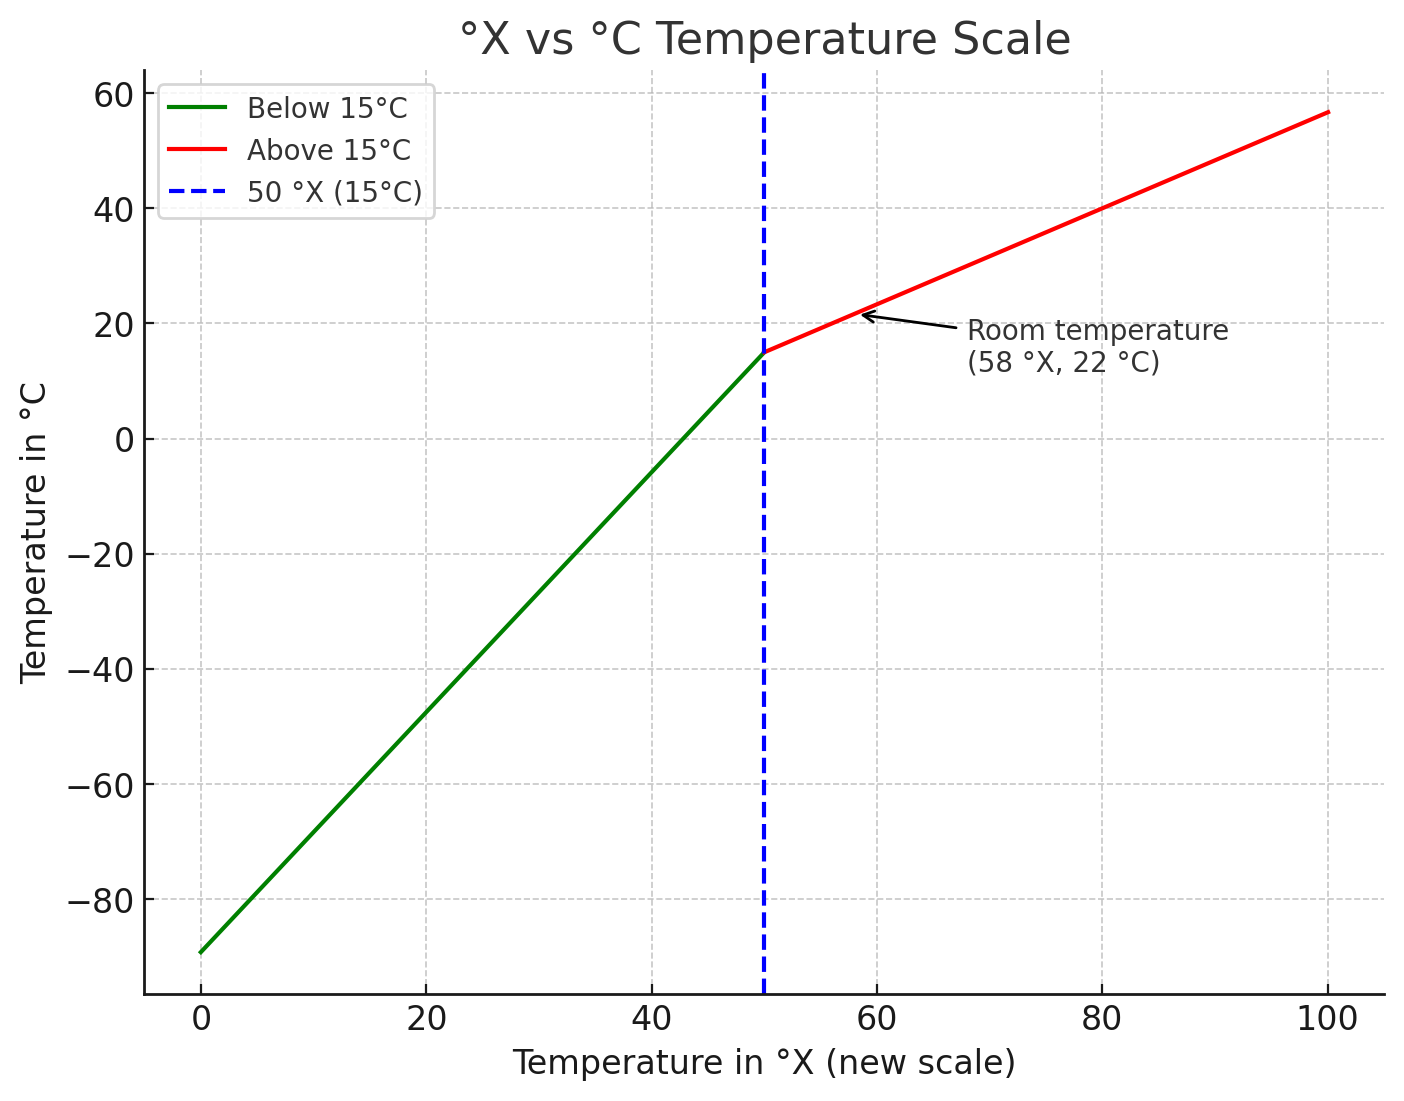 | 1,404 × 1,101 (114 KB) | Liv2splain (talk | contribs) | ||
| 06:31, 22 October 2024 |  | 1,404 × 1,101 (103 KB) | Liv2splain (talk | contribs) | Re 3001: Temperature Scales, chart showing the relationship between the °X and °C temperature scales. |
- You cannot overwrite this file.
File usage
The following 2 pages link to this file:
