1407: Worst Hurricane
| Worst Hurricane |
 Title text: 'Finding a 105-year-old who's lived in each location and asking them which hurricane they think was the worst' is left as an exercise for the reader. |
This comic has a larger version available.
Explanation[edit]
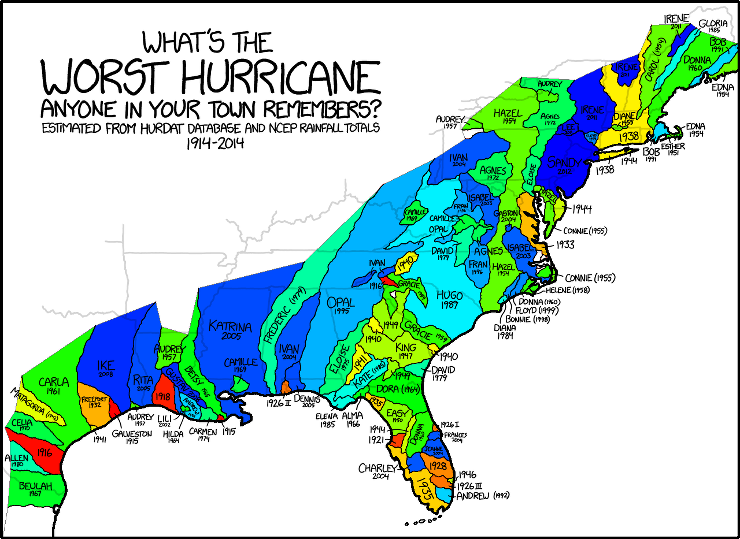
The map divides America's Atlantic coastline into regions according to the worst hurricane that has hit each area in the last century, based on data from the North Atlantic hurricane database (HURDAT) to determine the severity and the National Centers for Enrvironmental Prediction's (NCEP) rainfall to determine where the hurricane was present. Most of the hurricanes are listed by their US reporting names, with hurricanes before 1953 (the year when the current naming system was established) being listed by their year and sometimes a sequence number or city name.
The title text is a joke in light of this bleak humor, saying that finding residents in each of the regions who are old enough to have been alive through all of these is quite a daunting task. In principle, this would be the only way to confirm the "worst hurricane in living memory," and may be taken as a riposte to anyone who wishes to argue this map: "If you think there was a worse one, find a 105 year old resident who agrees!" 105 was likely chosen because most people can only remember back to an age when they were 5, so someone would have needed to be 5 years old to remember a hurricane in any detail 100 years later.
Hurricanes and especially their names have been featured before in comics 453: Upcoming Hurricanes, 944: Hurricane Names and 1126: Epsilon and Zeta.
Listed hurricanes[edit]
A full list of North Atlantic hurricanes after Tropical cyclone naming was introduced can be found here.
| Date | Name | States | Highest winds | Lowest pressure | Casualties
(Est. total) |
Damage estimate
(USD; uninflated) |
|---|---|---|---|---|---|---|
| 1915 | Galveston | LA TX OK AR | 145 mph | 940 mbar | 400 | $50 million |
| 1915 VI | LA MS AL TN KY WV PA | 145 mph | 931 mbar | 275 | $13 million | |
| 1916 | 1916 IV | SC NC | 115 mph | 960 mbar | 7 | $100,000 |
| 1916 VI | TX | 135 mph | 932 mbar | 15 | $1.8 million | |
| 1918 | 1918 I | LA | 120 mph | 955 mbar | 34 | $5 million |
| 1921 | 1921 VI | FL | 140 mph | 941 mbar | 6 | $3 million |
| 1926 | 1926 I | FL | 140 mph | 967 mbar | <287 | $16,401,000 |
| 1926 II | GA | 140 mph | 967 mbar | unknown | unreported | |
| 1926 III | TX LA AL | 115 mph | 955 mbar | 25 | $6million | |
| 1926 VII | FL AL MS LA | 150 mph | 930 mbar | 478 | $22 billion | |
| 1928 | 1928 IV | FL SC NC | 160 mph | ≤ 929 mbar | <4,078 | $100 million |
| 1932 | Freeport | TX | 150 mph | 935 mbar | 40 | $7.5 million |
| 1933 | 1933 VI | NC VA MD PA | 140 mph | 940 mbar | 31 | $27 million |
| 1935 | 1935 III | FL | 185 mph | 892 mbar | <400 | unreported |
| 1938 | New England | NY CT | 160 mph | 940 mbar | 682 | $300 million |
| 1940 | 1940 III | SC NC | 100 mph | 972 mbar | 50 | $13 million |
| 1941 | 1941 II | LA TX | 125 mph | 942 mbar | 4 | $7 million |
| 1942 | Matagorda | TX NM OK | 115 mph | 950 mbar | 8 | $26.5 million |
| 1944 | 1944 VII | NY NC to CT | 145 mph | 933 mbar | 390 | <$100 million |
| 1944 XIII | FL | 145 mph | 937 mbar | 300 | $100 million | |
| 1946 | 1946 VI | FL NC | 100 mph | 977 mbar | 5 (in Cuba) | $5.2 million |
| 1947 | King | FL GA SN NC | 105 mph | 965 mbar | 1 | $20 million |
| 1949 | 1949 II | FL GA to NH | 130 mph | 954 mbar | 2 | $52 million |
| 1950 | Easy | FL GA AK | 125 mph | 958 mbar | 2 | $3.3 million |
| 1954 | Carol | NY CT NH NC MA VA DC DE NJ | 115 mph | 957 mbar | 72 | $462 million |
| Edna | NY VA NC NJ MA ME NH | 120 mph | ≤ 954 mbar | 29 | >$42.8 million | |
| Hazel | NC VA WV MD DE NY PA NJ DC | 150 mph | ≤ 937 mbar | 1,000-1,200 | $420 million | |
| 1955 | Connie | NC SC VA DC MD MI PA NJ NY | 145 mph | 936 mbar | 74 | <$86 million |
| Diane | PA NJ NY NC WV MA RI VT | 120 mph | ≤ 969 mbar | ≥184 | $754.7 million | |
| 1957 | Audrey | TX FL LA MS AL MI MO IL NY PA VT ME | 145 mph | 945 mbar | <416 | $147 million |
| 1958 | Helene | SC to ME | 135 mph | 934 mbar | 1 | $11.4 million |
| 1959 | Gracie | SC GA VA PA | 140 mph | 950 mbar | 22 | $14 million |
| 1960 | Donna | FL GA SC NC VA MD PA NJ NY CT MA VT NH | 160 mph | 932 mbar | 164-364 | $900 million |
| 1961 | Carla | TX LA OK IL FL NE MO MI WI IN AL AK MS IA | 175 mph | 931 mbar | 43 | $325.74 million |
| Esther | NC VA MD DE NJ NY CT MA NH | 145 mph | 927 mbar | 7 | $6 million | |
| 1964 | Dora | FL | 130 mph | 942 mbar | 5 | $250 million |
| Hilda | FL TX LA GA MS NC SC AL TN VA MD DE | 150 mph | 941 mbar | 38 | $126 million | |
| 1965 | Betsy | FL LA MS AR TE MO | 155 mph | 941 mbar | 81 | $1.42 billion |
| 1966 | Alma | FL (up to FL/GA border) | 125 mph | 970 mbar | 91 | $210.1 million |
| 1967 | Beulah | TX | 160 mph | ≤ 923 mbar | 688 | $1 billion |
| 1969 | Camille | MS LA WV VA | 175 mph | 900 mbar | 259 | $1.42 billion |
| 1970 | Celia | FL TX | 125 mph | 945 mbar | 28 | $930 million |
| 1972 | Agnes | FL GA NC VA MD PA NY | 85 mph | 977 mbar | 128 | $2.1 billion |
| 1974 | Carmen | LA TX | 150 mph | 928 mbar | 8 | $162 million |
| 1975 | Eloise | FL | 125 mph | 955 mbar | 80 | $560 million |
| 1979 | David | FL | 175 mph | 924 mbar | <2,068 | $1.54 billion |
| Frederic | FL AS MS | 135 mph | 943 mbar | 14 | $2.3 billion | |
| 1980 | Allen | TX | 190 mph | 899 mbar | 269 | $1.24 billion |
| 1984 | Diana | FL SC NC | 130 mph | 949 mbar | 3 | $65.5 million |
| 1985 | Elena | FL AL MS LA AR KY | 125 mph | 953 mbar | 9 | $1.3 billion |
| Gloria | NC VA MD DE NJ NY MA ME CT RI NH ME | 145 mph | 919 mbar | 14 | $900 million | |
| Kate | Fl GA | 120 mph | 954 mbar | 15 | $700 million | |
| 1989 | Hugo | SC NC VA WV OH VI | 160 mph | 918 mbar | ±107 | $10 billion |
| 1991 | Bob | NC ME MA NH VT RI CT | 115 mph | 950 mbar | 17 | $1.5 billion |
| 1992 | Andrew | FL LA | 175 mph | 922 mbar | 65 | $26.5 billion |
| 1995 | Opal | AL FL GA | 150 mph | 916 mbar | 63 | $5.1 billion |
| 1996 | Fran | SC NC VA WV MD PA | 120 mph | 946 mbar | 27 | $3.2 billion |
| 1998 | Bonnie | NC | 115 mph | 954 mbar | 5 | $1 billion |
| 1999 | Floyd | FL to ME | 155 mph | 921 mbar | 77-87 | $6.9 billion |
| 2002 | Lili | LA MS AK | 145 mph | 938 mbar | 15 | $925 million |
| 2003 | Isabel | NC to PA | 165 mph | 915 mbar | 51 | $5.37 billion |
| 2004 | Charley | FL SC NC | 150 mph | 941 mbar | 35 | $16.3 billion |
| Frances | VI PR FL | 145 mph | 935 mbar | 49 | $9 billion | |
| Gaston | SC NC VA MD DE MA | 75 mph | 985 mbar | 9 | $130 million | |
| Ivan | AL FL LA TX | 165 mph | 910 mbar | 123 | $18 billion | |
| Jeanne | VI PR FL | 120 mph | 950 mbar | <3,035 | $7 billion | |
| 2005 | Dennis | Fl Al MS GA TN OH | 150 mph | 930 mbar | 89 | $4 billion |
| Katrina | FL LA MS AL | 175 mph | 902 mbar | <1,833 | $108 billion | |
| Rita | FL MS LA TX AR MO IL | 180 mph | 895 mbar | 97-125 | $12 billion | |
| 2008 | Gustav | PR AL MS LA TX OK AR MO IL MI | 155 mph | 941 mbar | 153 | $6.61 billion |
| Ike | FL OH LA TX MS | 145 mph | 935 mbar | 195 | $37.5 billion | |
| 2011 | Irene | NC CT NJ NY | 120 mph | 942 mbar | 56 | $16.6 billion |
| Lee | NY PA | 60 mph | 986 mbar | 18 | $1.6 billion | |
| 2012 | Sandy | NJ NY PA MD DE | 115 mph | 940 mbar | 286 | ≥ $68 billion |
Transcript[edit]
- What's The
- Worst Hurricane
- Anyone In Your Town Remembers?
- Estimated from Hurdat Database and NCEP rainfall totals
- 1914-2014
- [A map of the east coast of the United States as far southwest as the Texas/Mexico border, as far northeast as the Maine/Canada border, and as far inland as Kentucky. The map has coastal regions blocked out with the name and year of the worst hurricane in the last 100 years.]
Map[edit]
| Date | Hurricane name | States (Postcode form) |
|---|---|---|
| 1915 | Galveston | LA TX OK AR |
| 1915 VI | LA MS AL TN KY WV PA | |
| 1916 | 1916 IV | SC NC |
| 1916 VI | TX | |
| 1918 | 1918 I | LA |
| 1921 | 1921 VI | FL |
| 1926 | 1926 I | FL |
| 1926 II | GA | |
| 1926 III | TX LA AL | |
| 1926 VII | FL AL MS LA | |
| 1928 | 1928 IV | FL SC NC |
| 1932 | Freeport | TX |
| 1933 | 1933 VI | NC VA MD PA |
| 1935 | 1935 III | FL |
| 1938 | 1938 VI | NY CT |
| 1940 | 1940 III | SC NC |
| 1941 | 1941 II | LA TX |
| 1942 | Matagorda | TX NM OK |
| 1944 | 1944 VII | NY NC to CT |
| 1944 XIII | FL | |
| 1946 | 1946 VI | FL NC |
| 1947 | King | FL GA SN NC |
| 1949 | 1949 II | FL GA to NH |
| 1950 | Easy | FL GA AK |
| 1954 | Carol | NY CT NH NC MA VA DC DE NJ |
| Edna | NY VA NC NJ MA ME NH | |
| Hazel | NC VA WV MD DE NY PA NJ DC | |
| 1955 | Connie | NC SC VA DC MD MI PA NJ NY |
| Diane | PA NJ NY NC WV MA RI VT | |
| 1957 | Audrey | TX FL LA MS AL MI MO IL NY PA VT ME |
| 1958 | Helene | SC to ME |
| 1959 | Gracie | SC GA VA PA |
| 1960 | Donna | FL GA SC NC VA MD PA NJ NY CT MA VT NH |
| 1961 | Carla | TX LA OK IL FL NE MO MI WI IN AL AK MS IA |
| Esther | NC VA MD DE NJ NY CT MA NH | |
| 1964 | Dora | FL |
| Hilda | FL TX LA GA MS NC SC AL TN VA MD DE | |
| 1965 | Betsy | FL LA MS AR TE MO |
| 1966 | Alma | FL (up to FL/GA border) |
| 1967 | Beulah | TX |
| 1969 | Camille | AS MS LA |
| 1970 | Celia | FL TX |
| 1972 | Agnes | FL GA NC VA MD PA NY |
| 1974 | Carmen | LA TX |
| 1975 | Eloise | FL |
| 1979 | David | FL |
| Frederic | FL AS MS | |
| 1980 | Allen | TX |
| 1984 | Diana | FL SC NC |
| 1985 | Elena | FL AL MS LA AR KY |
| Gloria | NC VA MD DE NJ NY MA ME CT RI NH ME | |
| Kate | Fl GA | |
| 1989 | Hugo | SC NC VA WV OH VI |
| 1991 | Bob | NC ME MA NH VT RI CT |
| 1992 | Andrew | FL LA |
| 1995 | Opal | AL FL GA |
| 1996 | Fran | SC NC VA WV MD PA |
| 1998 | Bonnie | NC |
| 1999 | Floyd | FL to ME |
| 2002 | Lili | LA MS AK |
| 2003 | Isabel | NC to PA |
| 2004 | Charley | FL SC NC |
| Frances | VI PR FL | |
| Gaston | SC NC VA MD DE MA | |
| Ivan | AL FL LA TX | |
| Jeanne | VI PR FL | |
| 2005 | Dennis | Fl Al MS GA TN OH |
| Katrina | FL LA MS AL | |
| Rita | FL MS LA TX AR MO IL | |
| 2008 | Gustav | PR AL MS LA TX OK AR MO IL MI |
| Ike | FL OH LA TX MS | |
| 2011 | Irene | NC CT NJ NY |
| Lee | NY PA | |
| 2012 | Sandy | NJ NY PA MD DE |
Trivia[edit]
- Hurricanes have a maximum wind speed in the eye-wall around the centre of the storm. After a storm passes over land it loses the warm water needed to power it, and rapidly dissipates. Around the Caribbean Sea there are major storms, such as Katrina, that affect a long path inland, and storms such as Carmen that have had significant effects on local coastal areas. Further north the pattern changes, as hurricanes will be beginning to transform to an extra-tropical depression, and can intensify over land. There may be a degree of sample bias, as hurricanes from the early half of the twentieth century may not have been monitored as intensely after making landfall.
- Randall wrote "Esther 1951" instead of "Esther 1961" in the map.
Discussion
I tried to list all the unnamed hurricanes, but I gave up after 1938. Anybody feel like finishing it? 108.162.219.195 05:37, 13 August 2014 (UTC)
The current explanation seems to interpret the title text completely wrongly; it isn't about finding a person that lived in *all* of the states, but finding people that lived in *each*. The point is that the entire data is estimated based on rainfall, not based on actually asking people the question. 108.162.250.231 (talk) (please sign your comments with ~~~~)
- I very much doubt that the data was based on rainfall, which is pretty irrelevant to the severity of most hurricanes. The severity is generally a factor of storm surge and windspeed, rainfall only becomes relevant far inland.
- And the map is too small scale to really represent what you would get if actually asked people - for instance, in Fort Lauderdale it's unlikely anyone would say Andrew was worst (having been thru both Andrew and Wilma, I'd say Wilma was worse, but old timers in Fort Lauderdale would say the 1947 hurricane was worst). 108.162.238.182 (talk) (please sign your comments with ~~~~)
- Except the fact remains that the comic says it is based on rainfall. So why is wind speed and pressure on the table? 108.162.216.209
Hurricane Audrey was in June 1957. -- Jkrstrt (talk) (please sign your comments with ~~~~)
Some areas in the map is pretty large se Opal, Katrina, Hugo while others are very small like 1946 near the tip of Florida. I don't know much about hurricanes but could one draw a conclusion that the hurricanes in the small areas are not as bad as the larger ones (and that some large ones like those near Mexico, are large only because they don't receive many hurricanes)? Should one add a note in the description why not entire America is mapped? We know that the Atlantic is very good at producing hurricanes but why doesn't the Pacific Ocean produce as many? I write my comment out of curiousity hoping someone has the answers, not that I know much about this (I am not even an American). Aquaplanet (talk) 10:09, 13 August 2014 (UTC)
- That would be a false conclusion. The area of severe damage for a hurricane is fairly narrow (perhaps 50 miles wide), so if another hurricane has hit nearby, each would just be "worst" in a small area. Conversely, in an area that gets few hurricanes even light damage would count as "worst". Just for reference, in terms of deaths the three most severe hurricanes would be 1915 Galveston TX, 1926 Palm Beach FL, and 2005 Katrina MS/LA. In terms of wind strength, the three most severe would be 1935 Florida Keys, 1969 Camille MS, and 1992 Andrew (FL). 108.162.238.182 (talk) (please sign your comments with ~~~~)
- On the Pacific coast of the US we get no hurricanes. This is due to the cold water flowing south from Alaska rather than coming north from the equator. This in turn is due to the clockwise flow of large bodies of water in the northern hemisphere, which is in turn due to the coreolis effect (caused by the rotation of the earth.) In California we only remember hurricanes because we here about them on the news, or occasionally when we travel. 108.162.215.134 10:25, 13 August 2014 (UTC)BluDgeons
- There are no hurricanes in Pacific because they are called Typhoons (difference) and damage places like South East Asia where the concentration of news reporters is lower. -- Hkmaly (talk) 11:01, 13 August 2014 (UTC)
- Both of the above comments are mistaken. Tropical cyclones in the western Pacific are called hurricanes. It is possible (altho rare) for a hurricane to hit California (it's common in Baja California). If the map were expanded to include California and Arizona, 1997 Kathleen would probably be the worst anyone remembered. 108.162.238.182 (talk) (please sign your comments with ~~~~)
- West Pacific and Baja are not US which I specifically stated for that reason. I also doubt anyone remembers Hurricane Kathleen, I certainly don't. 173.245.54.197 08:56, 15 August 2014 (UTC)BluDgeons
- I swear there must be a small joke in there about the reporters, but the veil is a bit too opaque for me, I fear... Also, is it kosher for me to fix people's links, if it's evident what needs to be fixed, and what they meant to put? -- Brettpeirce (talk) 11:19, 13 August 2014 (UTC)
"'If you think there was a worse one, find a 105 year old resident who agrees!'" I would like to point out that if someone has the specific hurricane that they would like to claim to be worse than the presented one, they only need to find someone who experienced both hurricanes; there is no need for 105-year-olds every time.--Troy0 (talk) 12:16, 13 August 2014 (UTC)
Is there any rhyme or reason to the parentheses? I can't figure out why we have Connie (1955) and Diane 1955. jameslucas (" " / +) 13:10, 13 August 2014 (UTC)
If we make a complete list, are we ordering it chronologically or north-to-south? It seems easier to list it from Maine to Texas. Unless we can create a list that lets you adjust those fields which I don't know how to do173.245.56.152 12:44, 13 August 2014 (UTC)
- There is no proper north to south order, but we could create a table with name, year, state and description, so you can order by it. Condor70 (talk) 15:07, 13 August 2014 (UTC)
Very cool. And next someone could mash this up with a population density map and find the number of people likely to remember each one as "worst", then sort by that ro find the hurricane most-remembered as "worst". Nealmcb (talk) 15:43, 13 August 2014 (UTC)
This comic might have been inspired by Robin William's bit on hurricanes in Weapons of Self-Destruction in light of his recent death. 108.162.217.95 15:19, 13 August 2014 (UTC)
It might be of interest to colour the hurricanes by decade; see if there's a visible secular trend in hurricane "worseness". 141.101.98.187 20:24, 13 August 2014 (UTC)
- Like this? (smaller version isn't yet available or I'd link to that) --Mwarren (talk) 00:36, 14 August 2014 (UTC)

- Not really. That doesn't distinguish between hurricanes which were the worse over a small area, and the worse over a large area. A less bad hurricane that by chance hasn't been topped in a small locality has the same weight as a more intense one that was the worse over large tracts of land. What I was thinking of was colouring the map according to date - start at hue 0 (red) in 1914 and end at hue 200 (magenta) in 2014. The problem is that the potential sample bias mentioned would lead to a apparent trend to worser hurricanes, so any map so coloured wouldn't necessarily represent the reality of the record. 141.101.98.187 (talk) (please sign your comments with ~~~~)
- Like this, then?
- More details on my talk page. GuiRitter (talk) 12:50, 30 November 2015 (UTC)

That's beautiful but I thought it would be more like the tables here:http://en.wikipedia.org/wiki/List_of_elements (maybe not the best example) but each vertical column would be ordered so we'd have dates, states, severity, etc. Just basically like a grid. Maybe I was alone in that thought. 173.245.56.152 (talk) (please sign your comments with ~~~~) Suggestion: HSL model (or perhaps HSV) colour-space applied on the map such that Hue (say Red/0° up to Magenta/300°, the long way round) represents the year of a given hurricane, Saturation (if only to cash in on the obvious pun) depicts actual rainfall and Luminosity/Lightness or 'brightness' Value or the Intensity value (whatever it is you're using) can show windspeeds. If anyone can go back to the source data (which Randall has) it might even be possible to blend neighbouring zones together, although with this system that'd risk (say) a 1914 (Red-hued) hurricane neighbouring a 1954 one (Green-hued) giving a yellowed zone between them that might looking like an intersticial 1934 storm area (with rainfall/windspeed qualities based upon the combinatorial method you use). However, sticking to just the 'areas of majority', you could either flood-fill with their worst/greatest/typical HSX or (if the source data gives the required granularity) gradient it to show how (for example) 1995 Opal tails off into Tennessee, if my US geography is correct, while showing how Ivan's path interleaves the former patchily but (where it shows through against its competitors) doesn't evaporate, just get outdone. IYSWIM 141.101.99.7 12:38, 15 August 2014 (UTC)
- Restructured the list into a table. Would you like to fill in the states (I'm not familiar enough with US geography)? Condor70 (talk) 06:38, 15 August 2014 (UTC)
The 105 year old comment is probably based on the earliest storm shown on the map being 1915 Galveston; you'd have to be 105 years old to remember that one. 108.162.238.182 (talk) (please sign your comments with ~~~~)
Would/Should we add a section or modify what we have so we can rate by the more familiar categories (CAT 1, CAT 2, etc)?173.245.56.152 01:03, 17 August 2014 (UTC)
- Would it help understand the comic? 108.162.216.209 18:23, 9 December 2014 (UTC)
The Weather Channel reported on this comic as if people were actually asked about which hurricanes they remember. I'm not even certain TWC understood its provenance. 173.245.54.155 (talk) (please sign your comments with ~~~~)
I propose we remove much of the table, and provide the name of the hurricane the year, and a link to a reference to the hurricane if we can find one.108.162.216.209 18:23, 9 December 2014 (UTC)
All of the hurricanes are linked on Wikipedia, and the remarks are arbitrary facts pulled from that. There is no standard as to what kind of remark or interesting fact should be left. Some just link to the wikipedia article, which already happens in the initial listing, while others tried to find a cool or key fact, but this is the least fun part of completing this list especially when there is no uniformity to this section. I propose removing the remarks point as it's the most subjective and least scientific and least important aspect of the list. If people want to read more about the storm, they can click the link by the name. Anyone agree or disagree? 4jonah (talk) 17:26, 23 December 2014 (UTC)
I have a followup thought - just make remarks 2 figures: number killed and cost of damage. That's pretty empirical and would make for simple columns. This allows it to be filtered by most deadly and most costly
I'm giving total casualties. The Wiki pages sometimes say x deaths direct, y deaths indirect. I'm giving a unified total otherwise it gets too confusing. -- 4jonah (talk) (please sign your comments with ~~~~)
There were duplicate entries for 1926 such as, in a single column, "1926 "IIII/II." In addition to being out of sequence, no other year did this so I have each one it's own listing. We should remove the remarks section. Does anyone attend this page anymore?4jonah (talk) 18:34, 24 December 2014 (UTC)
This table has more listed than the map does. Are we going to have 2 separate, inconsistent lists? Or is the table going to have only what's on the map?4jonah (talk) 21:18, 26 December 2014 (UTC)
Hey, guys. I have been slowly working through the transcript, but the southern states are going to bee pretty crazy. If anyone wants to help, or maybe has a better idea for how to format the transcript, please do so. Reywas (talk) 21:02, 16 February 2015 (UTC)
The worst hurricane anyone in my town remembers is Ike. In fact, being from southwestern Ohio, Ike is the only hurricane anyone in my town remembers. 162.158.75.189 02:36, 13 December 2021 (UTC)
