2701: Change in Slope
| Change in Slope |
 Title text: Squinting at a graph is fine for getting a rough idea of the answer, but if you want to pretend to know it exactly, you need statistics. |
Explanation[edit]
The comic is a tip for detecting changes in slopes over a scatter plot of data. This is a common requirement in exploratory statistics for comparing trends in a series — finding the cutoff where the slope changes may reveal valuable information about the data.
The comic compares two methods. Firstly, a novice method — by 'doing a bunch of statistics'- i.e, applying various statistical tools to analyze the data and figure out the quantitative change in slope. This results in two equations for the trendlines above and below a given value, a box plot, a histogram, and a line chart. It is unknown exactly what methods the novice used to figure out the change in slope in the data. Possibilities include calculating the derivatives (which probably won't work well on noisy data such as shown), or gradients, or using a Savitzky-Golay filter or piecewise linear smoothing spline fits. Randall's light gray figures may be suggesting this method.
The other is the so-called 'expert' method, which involves tilting the page the graph is printed on to view changes in slope better. For small changes in an underlying trend, similar to that apparently shown in the comic, direct visual inspection cannot always identify or even reveal the effect. The comic shows, however, that by taking the page and rotating it in just the right way, the foreshortened perspective can make certain details much more apparent, allowing the 'expert' to see at a glance that there is a change in the slope. Ironically, tilting the comic to make the original roughly resemble the perspective of the 'tilted' version graph shown in the comic shows that the right-hand panel is slightly exaggerated for visual effect. The use of perspective to make information pop into the audience's view has been used by artists for centuries.
However, applying such an approach to data plots can run into errors — the primary one being parallax error from the oblique viewing angle causing the observer to not necessarily identify or clearly find the point at which the slope changes. It also does not reveal any data about the quantitative value of the change in slope, merely proving the existence of one. Furthermore, noisy data might show an apparent slope change that is not representative of an actual change in the underlying data, so even more advanced statistics testing the hypothesis of whether an apparent slope change is real may likely be a good idea.
The title text then goes on to say that, while such a trick is useful to identify that there is some change in slope, in order to pretend to know it exactly one must revert to statistics (the "novice method") to obtain some form of information, defeating some of the premise of the comic. This at least produces a semblance of statistical rigor although, once an answer appears obvious, data could be interpreted to reach an answer that you are now expecting rather than revealing something of more statistically useful significance.
Transcript[edit]
- How to detect a change in the slope of your data
- [First column, on the left]
- Novice method:
- [A graph, with dots forming a rough line, math formulas, and sub graphs]
- Do a bunch of statistics
- [Second column, on the right]
- Expert method:
- [Perspective view of the previous graph, with the legend "Hey look, it bends here" and an arrow pointing to the graph]
- Tip the graph sideways
Discussion
I am an occasional data scientist, and I can confirm this is why we have monitor stands that tilt. 172.71.94.50 16:33, 21 November 2022 (UTC)
The third e in "neeed" in the title text seems to be a typo Victor (talk) 16:41, 21 November 2022 (UTC)
- I think Randall may have added it to represent that the speaker prolongs the "e" sound for emphasis, although that's usually done with 4-5 e's. Barmar (talk) 16:53, 21 November 2022 (UTC)
- I had to double-check this, myself (presumed the 'Bot created the lage faithfully, but went straight to source to see if I needed to find a vandalism post to revert). May need a comment (to prevent hypercorrection, if not to note the implied emphisis) and certainly will if it turns out to be a typo and gets corrected (for which I'm sure a future checker will discover Randall's revisiting, but then worth a note to that effect). 172.70.90.2 17:42, 21 November 2022 (UTC)
Bender Bot was one of the main characters in Futurama. Barmar (talk) 16:54, 21 November 2022 (UTC)
- Just donning my unnecessary pedantry hat for a moment: his name is Bender Bending Rodriguez --192·168·0·1 (talk) 23:02, 21 November 2022 (UTC)
A couple(?) of authors used the word(s) "(point of) inflection", which is not really suitable for a join between two straight segments. Was tempted to talk about "discontinuity", but that really only applies to the meta-slope (derivatives, to one degree or other) where it suddenly jumps (at a point), or the derivative's derivative has jumps (as it enters and leaves the smoothly linking curve). Hope it works well enough how I left it, though. 162.158.142.176 21:28, 21 November 2022 (UTC)
For anyone curious, I used an image editor to turn the entire comic sideways and it actually does seem to work, to some degree anyway. SSM24 23:37, 21 November 2022 (UTC)
- Added; thanks! 172.71.158.230 00:14, 22 November 2022 (UTC)
- If you don't mind sharing: which program did you use? Did you tweak things like relative distance / camera FOV, to effectively select a specific point in the continuum that makes up the Dolly Zoom effect, and at the limit on one end results in orthographic projection? (Edit 10 minutes later: a better article to look at is Perspective distortion (photography)) Or did you just leave it at whatever the default is? Can you recreate the image with the two extremes, and share them? And lastly - can you upload the image (and potentially the new images) to the wiki directly, so they can be embedded in the page? Thanks! --NeatNit (talk) 17:21, 22 November 2022 (UTC)
This one shows the beauty of Explainxkcd: people reading the explanation are likely to learn accessible methods of substantial practical utility. 162.158.166.173 00:38, 22 November 2022 (UTC)
Hey, if it works for picking out lumber at Lowe’s, why not for graphs, too? - MadMarie
- There was an old bit of explanation that related it to examining physical objects (for dent/bend-removal in metalwork, I think it was) that got wiped out by a later edit. Though I'm considering my own version, now generalised to cover your experience, as it seems quite relevant/analogous to me. 172.70.90.2 14:37, 22 November 2022 (UTC)
Whoever wrote the 1st explanation needs to go touch grass and learn how real people talk, pissed me off so much I just effectively rewrote the whole thing from scratch 172.71.202.46 06:34, 22 November 2022 (UTC)
- Intrigued, looking at the first explanation (give or take that person's initial small errors/omissions) I personally find it more to the point than what it has become. Not to say the complete rewrite was wrong, but it got it not that much closer to the mythical perfection. IMO. 141.101.76.169 20:29, 22 November 2022 (UTC)
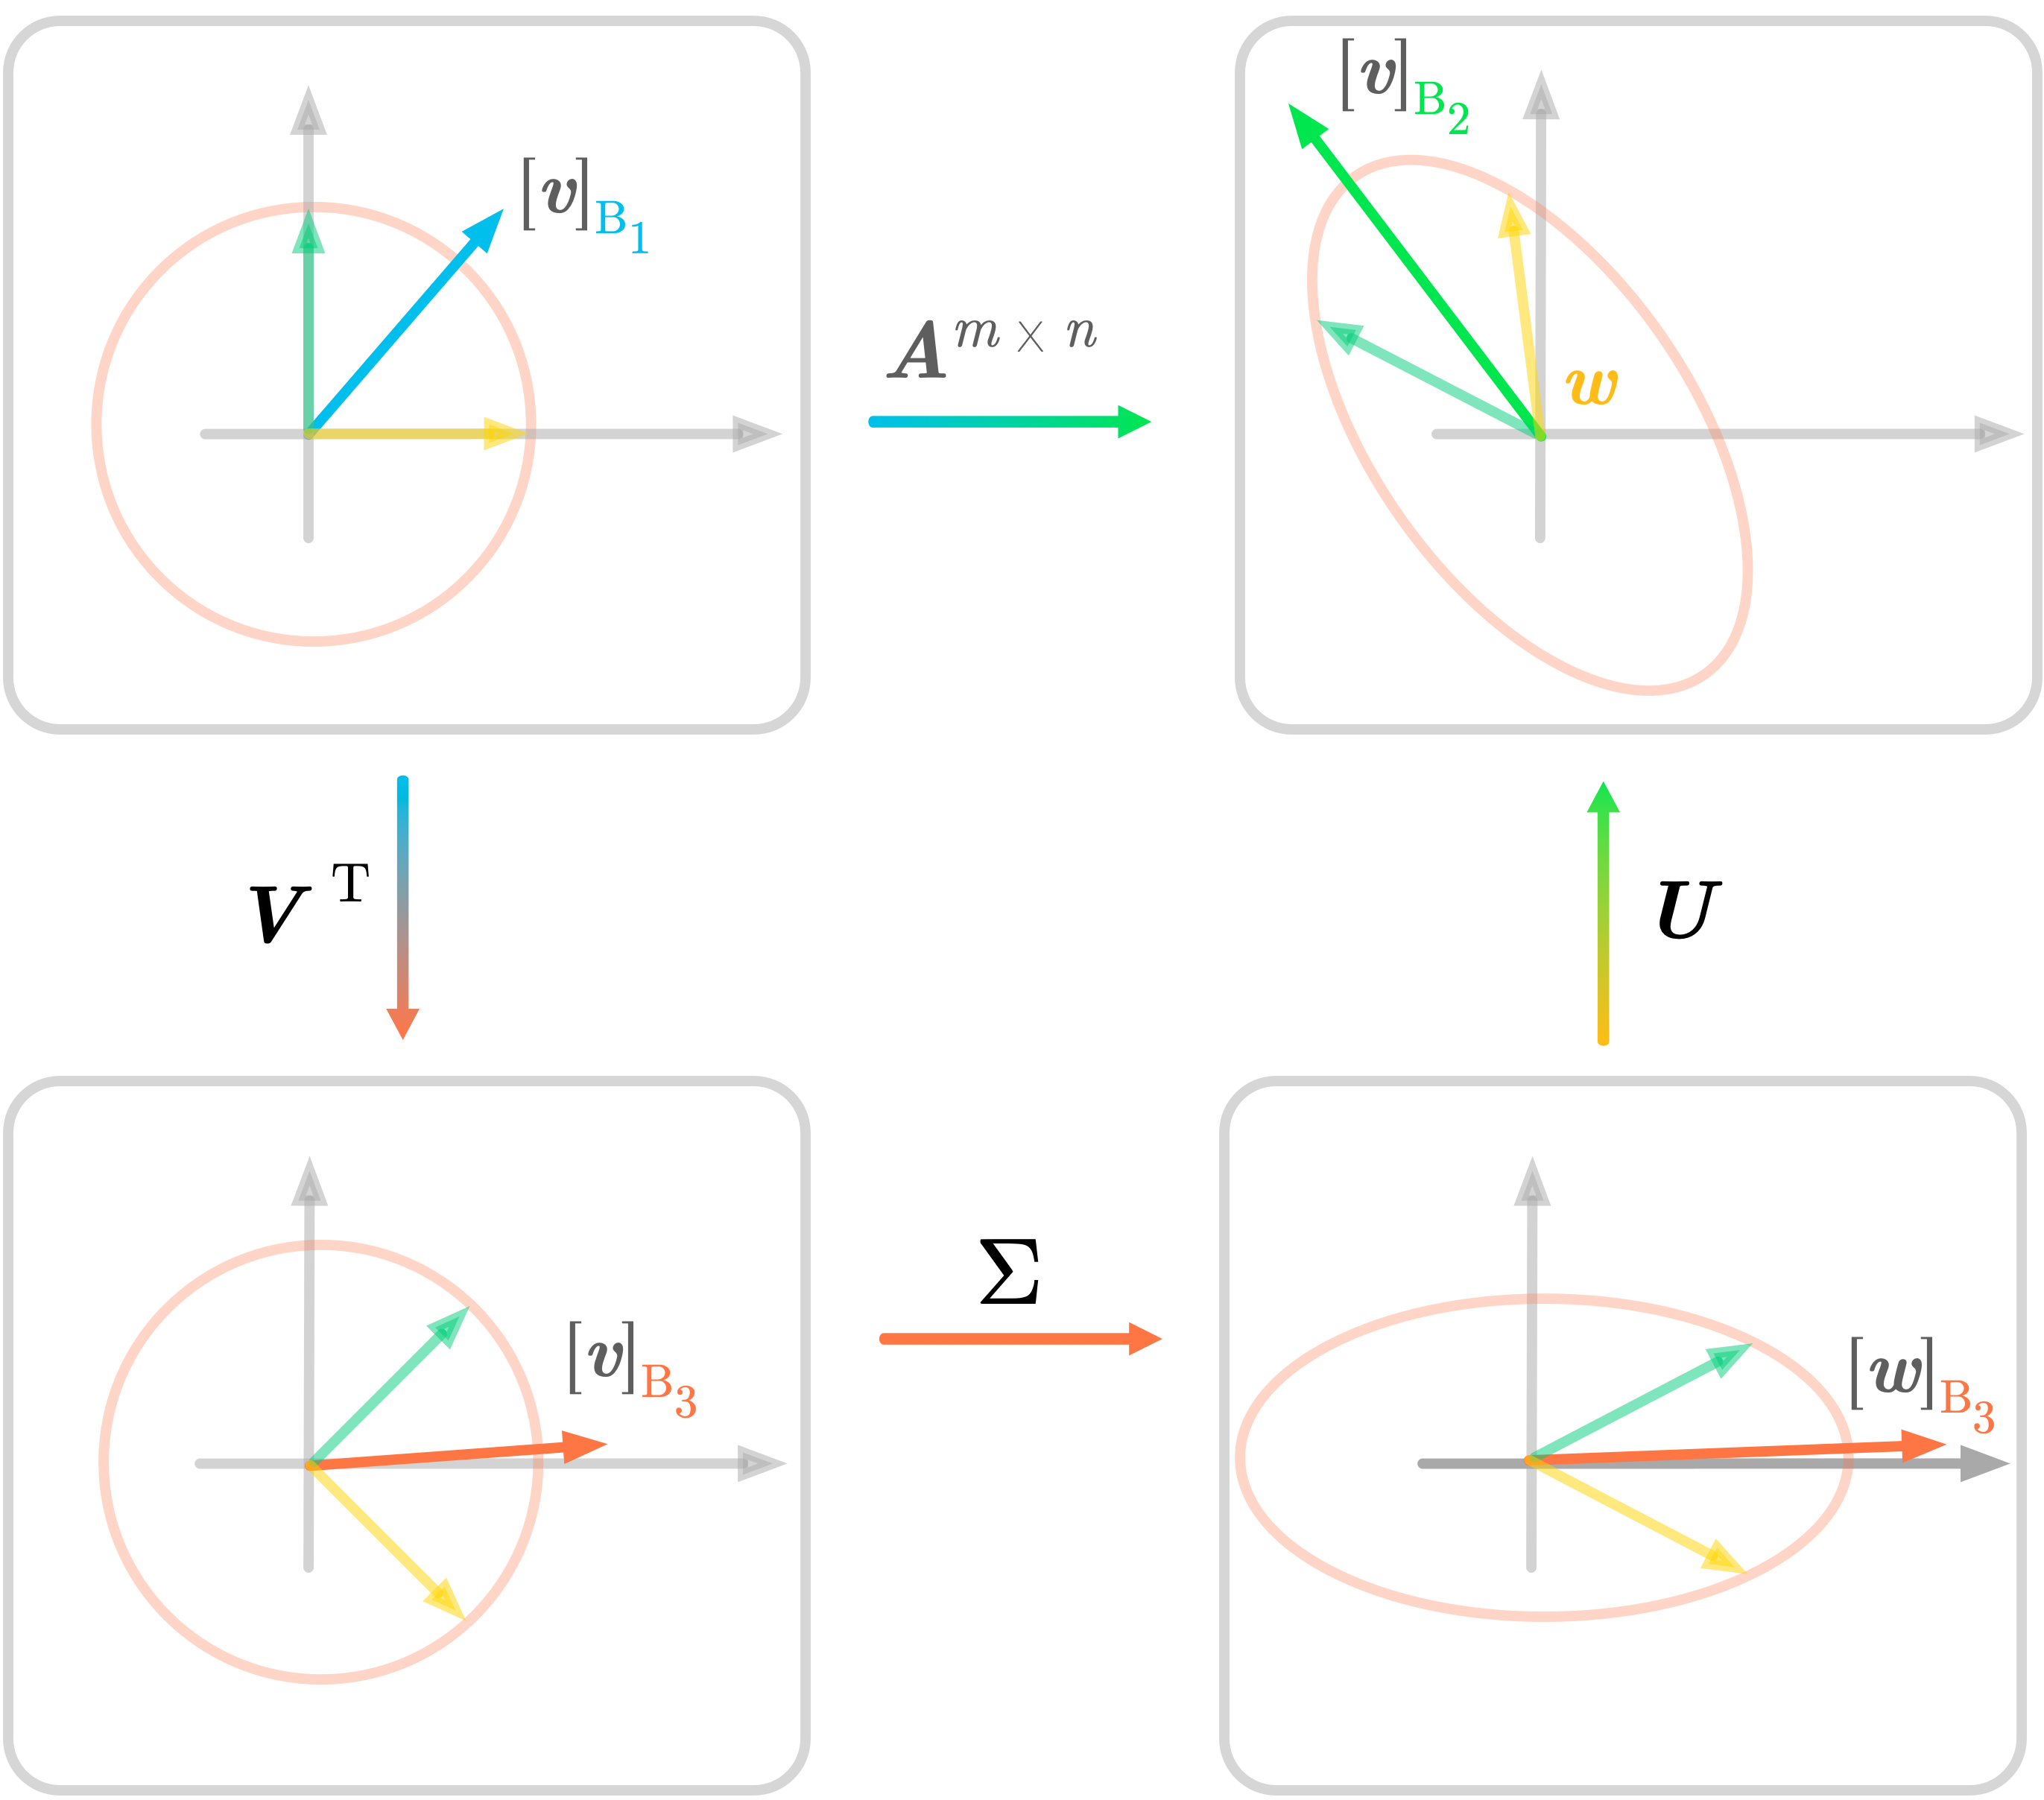
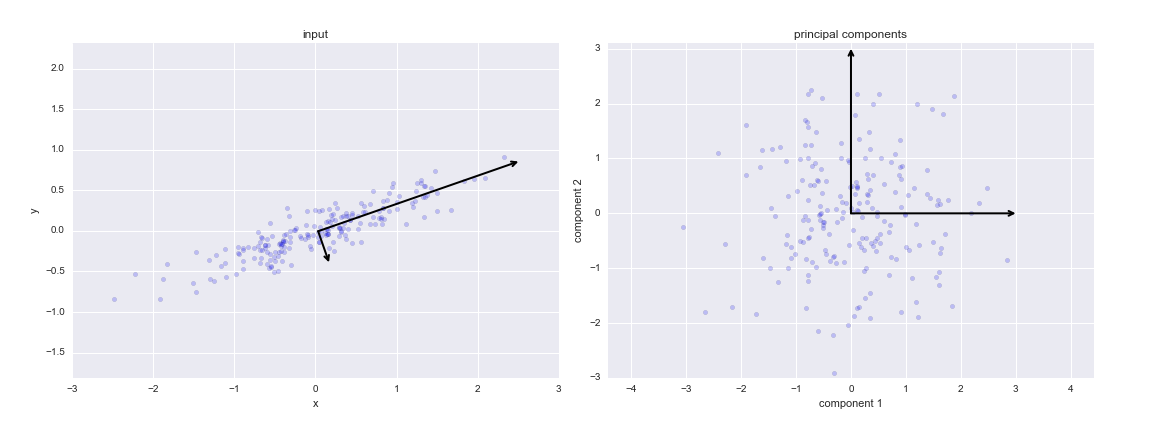
Going in a different direction than "this is silly" - if we ignore the "viewing point/parallax" issue, doing a change of basis like this is similar to linear methods like [SVD https://hadrienj.github.io/assets/images/ch12_svd/ch11_SVD_geometry.png] & PCA, and considering the graph as a mappingg in a "higher dimension" is similar to the "kernel trick" popularized by Support Vector Machines 11:31, 22 November 2022 (UTC)
Raw Data[edit]
I love this cartoon. This is definitely something that was relevant in my work!
At my old job I had some commercial or public-domain software for extracting the raw data behind a scatter plot. If anyone has something like that handy, I would love to see someone extract the data behind the graph on the left, so that we can:
  1. Apply the affine transformation which generates the image on the right with the tilted paper.
  2. Apply the statistical tests which Randall Munroe is alluding to.
- Knock yourself out:
| Digitized data courtesy https://apps.automeris.io/wpd/ |
|---|
0.000000, 0.015366 0.001887, 0.000000 0.002830, 0.041488 0.024528, 0.060695 0.033019, 0.014597 0.038679, 0.009988 0.044340, 0.072220 0.047170, 0.055317 0.050000, 0.072220 0.064858, 0.092964 0.070215, 0.117001 0.088207, 0.088354 0.091037, 0.122928 0.091037, 0.109099 0.100943, 0.140215 0.103773, 0.165338 0.106603, 0.178246 0.128891, 0.171331 0.147641, 0.196685 0.146226, 0.187465 0.162264, 0.215124 0.180188, 0.264910 0.182452, 0.218812 0.202830, 0.275052 0.204245, 0.261222 0.208490, 0.272747 0.217923, 0.293491 0.227358, 0.267369 0.230322, 0.234880 0.241744, 0.311930 0.256603, 0.344199 0.262263, 0.338930 0.299056, 0.376467 0.308254, 0.420261 0.313206, 0.417956 0.336791, 0.456371 0.344338, 0.433322 0.355659, 0.456371 0.367923, 0.496323 0.374055, 0.503237 0.388206, 0.503237 0.389621, 0.514762 0.409433, 0.533201 0.412263, 0.525518 0.415093, 0.540884 0.432074, 0.555328 0.446225, 0.599275 0.443395, 0.588519 0.449526, 0.537811 0.449055, 0.588519 0.468866, 0.609263 0.487263, 0.627702 0.490093, 0.636922 0.516979, 0.670727 0.523448, 0.697179 0.519809, 0.662276 0.548111, 0.697618 0.551413, 0.740642 0.550941, 0.689935 0.565092, 0.726813 0.572168, 0.724508 0.576413, 0.772911 0.582073, 0.772911 0.582073, 0.763691 0.601177, 0.785588 0.604714, 0.791350 0.625335, 0.775545 0.643394, 0.817473 0.664620, 0.855119 0.688812, 0.871693 0.688003, 0.821643 0.710374, 0.925035 0.707544, 0.806716 0.715091, 0.888156 0.717921, 0.880473 0.724148, 0.976665 0.749054, 0.927010 0.757544, 0.961913 0.763204, 0.959608 0.783016, 0.983426 0.781601, 0.971133 0.797166, 1.028756 0.802827, 1.031060 0.805657, 0.999560 0.821223, 0.966523 0.822638, 0.957304 0.842449, 1.038744 0.843864, 1.028756 0.859431, 1.049500 0.865091, 1.058719 0.876411, 1.077159 0.882072, 1.086378 0.889147, 1.077159 0.901883, 1.024914 0.904714, 1.017231 0.908605, 1.100208 0.913204, 1.107122 0.936553, 1.130171 0.937261, 1.116342 0.967447, 1.159370 0.969806, 1.205310 0.978301, 1.104817 0.983956, 1.101525 1.000000, 1.167820 |
- 104 points. 172.71.154.39 19:17, 22 November 2022 (UTC)
- I only count 69 distinct dots, although a handful look like they might be merged pairs. What's up with that? 172.70.210.48 04:54, 26 November 2022 (UTC)
- Can someone please check my work https://colab.research.google.com/drive/1c_7Qj3S1VXtL-AckfSfHCd4ofGYYDYH5 and tell me if I'm doing it right? I'm pretty sure I don't really know what I'm doing. I kind of cargo cult-coded the Savitzky-Golay filter stuff linked from the explanation and have zero understanding of what's actually going on. 172.70.211.126 21:58, 22 November 2022 (UTC)
- Here's how Randall seems to be suggesting to do it, based on the light gray figures: [superceded] -- Can someone please help fix the residuals on the second plot? 172.71.154.158 01:18, 23 November 2022 (UTC)
- I fixed the residuals and added an inset confidence interval comparisons for the two slopes, split by both their maximum difference and by the maximum sum of the r2 values: https://colab.research.google.com/drive/1apKDIN5FE32mtGiQew5cE6wK6m6eM_Fr It's not clear from the gray text which method Randall is suggesting. 172.70.211.126 22:07, 24 November 2022 (UTC)
- I added this to the end of the Colab notebook:
- I fixed the residuals and added an inset confidence interval comparisons for the two slopes, split by both their maximum difference and by the maximum sum of the r2 values: https://colab.research.google.com/drive/1apKDIN5FE32mtGiQew5cE6wK6m6eM_Fr It's not clear from the gray text which method Randall is suggesting. 172.70.211.126 22:07, 24 November 2022 (UTC)
- Here's how Randall seems to be suggesting to do it, based on the light gray figures: [superceded] -- Can someone please help fix the residuals on the second plot? 172.71.154.158 01:18, 23 November 2022 (UTC)
# Later in the Explainxkcd explanation, a "Significance of the Difference between Two Slopes Calculator"
# at https://www.danielsoper.com/statcalc/calculator.aspx?id=103 is recommended, so ... we get:

# split by maximum slope difference:  (as shown in green and red)
#   t-Value:               5.52246856
#   Degrees of freedom:  100
#   Probability:           0.00000027 (significant as < 0.05)

# split by maximum sum of r²s:
#   t-Value:               6.25478825
#   Degrees of freedom:  100
#   Probability:           0.00000001 (also very significant)

# So, while the latter might technically be  about 27 times more likely, both represent undoutably
# different linear fits. Perhaps someone can ask Randall which he was suggesting, if indeed either?
- What's the most reliable way to ask Randall this? Twitter? Email? Google Chat? 172.71.158.91 23:08, 24 November 2022 (UTC)
- Why don't you generate a series of mildly noisy datasets of two slightly different but random lines each and see which method gets closest to the generating parameters? Also, please put more blank lines in your code, and consider right-aligning the comments. 172.70.211.146 01:56, 26 November 2022 (UTC)
- What's the most reliable way to ask Randall this? Twitter? Email? Google Chat? 172.71.158.91 23:08, 24 November 2022 (UTC)
What's funny is people are doing a lot of statistics and computer magic when you can just tilt your screen like the comic says and get the same effect :P 172.70.54.52 (talk) 16:14, 25 November 2022 (please sign your comments with ~~~~)
- (Ɔ┴∩) ᄅᄅ0ᄅ ɹǝqɯǝʌoN ϛᄅ 'ㄣϛ:ㄥƖ ᄅᄅᄅ˙ᄅ9Ɩ˙0ㄥ˙ᄅㄥƖ ¡ƃuoɹʍ ʇᴉq ɐ ʇuǝʍ ƃuᴉɥʇǝɯos ʇnq 'ʇɐɥʇ pǝᴉɹʇ I
