Difference between revisions of "File:Explanation length.png"
| Line 1: | Line 1: | ||
Using the Colab notebook linked from [[2701: Change in Slope]] | Using the Colab notebook linked from [[2701: Change in Slope]] | ||
| + | <!-- There is currently no Talk page to say this, so saying it here... This image seems to suggest that there is some form of consistent trend, comic to comic, of how much explanation there needs to be. Takes no account of the possibility of one comic having a lot of subtle references (or whatever), but a neighbouring one just being so obviously one thng. This graph is 'trying' to statistically analyse something that is statistically not relevent. It looks good (and it's funny, which *perhaps* is the main intent? ...though I'm not sure about that...), but it's totally meaningless as any kind of factual/counter-factual information, the source information is too noisy and independent of any attempt to create a meaningful trend. (Also, ~~~~ won't do anything within this comment. If someone creates the Talk page just to put this in there and supply some sort of signature with the right timestamp, etc, ok?) --> | ||
[[Category:Helper comic images]] | [[Category:Helper comic images]] | ||
Latest revision as of 20:47, 18 April 2026
Using the Colab notebook linked from 2701: Change in Slope
File history
Click on a date/time to view the file as it appeared at that time.
| Date/Time | Thumbnail | Dimensions | User | Comment | |
|---|---|---|---|---|---|
| current | 10:50, 3 April 2023 | 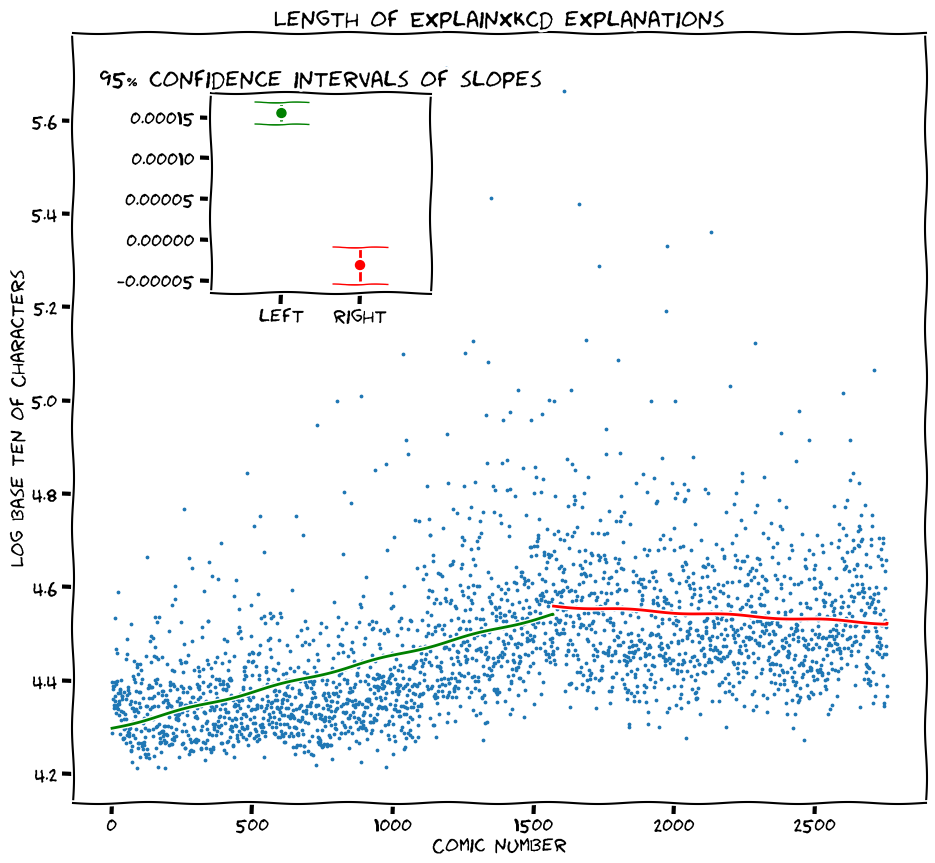 | 935 × 863 (131 KB) | Liv2splain (talk | contribs) | Using the Colab notebook linked from 2701: Change in slope |
- You cannot overwrite this file.
File usage
The following 3 pages link to this file:
