2341: Scientist Tech Help
| Scientist Tech Help |
 Title text: I vaguely and irrationally resent how useful WebPlotDigitizer is. |
Explanation
| This is one of 59 incomplete explanations: Created by a WASP-INFESTED LAB. Please mention here why this explanation isn't complete. Do NOT delete this tag too soon. If you can fix this issue, edit the page! |
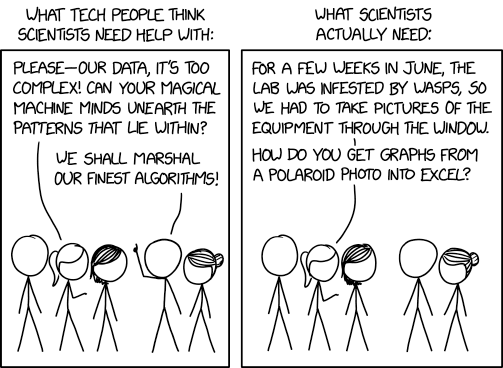
In this comic, Randall pokes fun at stereotypes of scientists that tech people hold.
Large portions of machine learning hinge around finding a pattern (either regression or classification) in a given data set, but the more common, real world problem is in data cleaning and preparation. For the most part, the rest can be done with preexisting implementations. This comic exaggerates this, with the scientists asking for help with a much more fundamental problem of data format than normal (image vs spreadsheet, as opposed something more normal like pixel-wise vs vertex based segmentation).
Transcript
| This is one of 39 incomplete transcripts: Do NOT delete this tag too soon. If you can fix this issue, edit the page! |
There are two panels. The one on the left is titled What tech people think scientists need help with
The one on the right is titled What scientists actually need:
Discussion
First. Goodbye, world! (talk) 23:19, 3 August 2020 (UTC)
But more importantly, I added a transcript and added definitions for a Polaroid and Excel. Also, how should I deal with multiple Cueballs in the transcript? Goodbye, world! (talk) 23:35, 3 August 2020 (UTC)
- I don't think it is 2 Cueballs. I think the one on the right is Cueball and I don't recognise the other one. He is drawn slightly differently, he's got a bit of a butt-head (crack-head?). Xseo (talk) 07:23, 4 August 2020 (UTC)
I know of a team whose data was in the form of images - tens of thousands of them. Somehow during a pre-processing step they lost the exif data for the image files - which held the only digital link between the image file which had names assigned by the cameras like Img237856.png and their science which needed things like date and time of the image..... Fortunately the image itself had the date and time in a banner across the bottom 100 pixels. Managed to read the banner using OCR and tesseract. Not so very far off the thrust of this comic! 162.158.126.134 00:08, 4 August 2020 (UTC)
I feel old when I know that Polaroid was not a disposable camera; it was an instant camera, meaning that the picture was taken, the film was slowly ejected from the camera body and you held the picture as it developed before your eyes. There were one-time use cameras, or "disposable" cameras, that were made cheaply and the camera was sent in for processing. Yes, probably incomprehensible to one so young to not know what a rotary dial desk phone (or wall phone) was. Doubting Thomas (talk) 00:41, 4 August 2020 (UTC)
I think the resentment stems from the ugly truth that such tool is needed in the first place? Is that a possibility? 172.69.134.229 01:48, 4 August 2020 (UTC)
- Don't the scientists own the data since they collected it on their own equipment?Nk1406 (talk) 13:51, 4 August 2020 (UTC)
"As you can see from the graphs, we detected significant Gravity Wave events on average once every 30-40 days for the whole two years of the observations, except for this short period where we seemed to get a consistently low level of background noise hum, that we have yet to fully connect with any of our existing astrophysical theories..." 162.158.154.131 10:17, 4 August 2020 (UTC)
A serious suggestion: instead of webplotdigitizer, if you want to grab data off a chart image, get the java-based DataThief, https://datathief.org/ . It's fast, very customizable, can handle a certain amount of image distortion, i.e. X and Y axes not perpendicular in the crappy image your uncle sent you. Cellocgw (talk) 10:42, 4 August 2020 (UTC)
I thought that the title text meant that webplotdigitizer is being recommended in this sintuation, and that past recommendations for similar problems were ignored. They irrationally hold out hope that the software will be used and remembered by the scientists. Operating the software is also not the interesting challenge the tech people were hoping to be presented to them. 162.158.74.155 18:10, 4 August 2020 (UTC)
Very shortly after this comic published I started seeing several articles about how geneticists recently renamed several genes so they would stop auto-formatting as dates in Excel. I wonder if Randall knew this before he drew the comic, and it was commentary on that, or if by amazing coincidence the world spewed out the perfect example of the scenario he was pointing out after the fact. For example, this Engadget article. 172.69.63.61 19:07, 9 August 2020 (UTC)
I have worked in many labs where an exposure is taken, or a photo even, or instruments are analog readouts that must be digitized. I have only used imageJ for this. I realize it says "graphs" (and also that the photos I took were with a digital camera, not poloroid) but there are examples of physical graphs- an old school temp tracer for instance. Or are those all charts? I'm not so pedantic these days, just a dumb labrat. anyway sorry, i don't know how to add comments here sorry for probably screwing something up (unregistered user- hi i'm Gian!)172.69.34.18 16:00 hundred hours, 17 August 2020 (I'm using local US west coast time, lol)