Difference between revisions of "2240: Timeline of the Universe"
m (Fix typo) |
(→Explanation: A reference to dark matter and dark energy and a descripton "which events".) |
||
| Line 10: | Line 10: | ||
{{incomplete|Created by the BIG BANG. Should include a list of the events, their times, and if they're real, explain what they are, and if they're jokes, explain what they are. Do NOT delete this tag too soon.}} | {{incomplete|Created by the BIG BANG. Should include a list of the events, their times, and if they're real, explain what they are, and if they're jokes, explain what they are. Do NOT delete this tag too soon.}} | ||
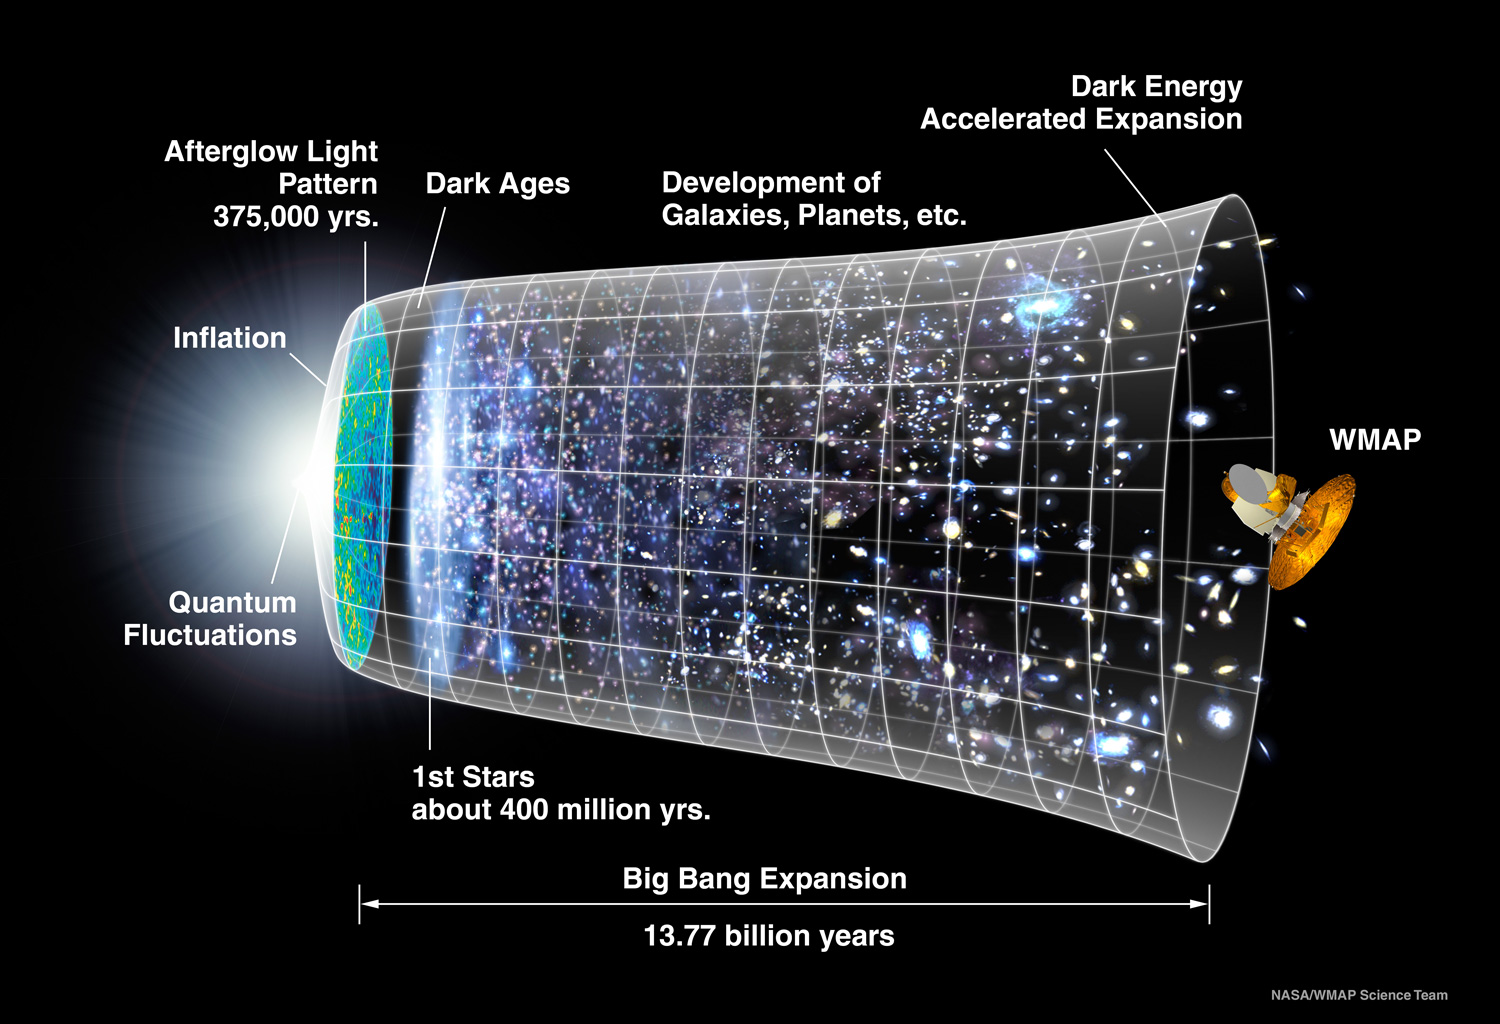
| − | This comic is about the size of the universe, presented as a timeline. Some events | + | This comic is about the size of the universe, presented as a timeline. Some events it describes as being caused by inflation or causing it are real, but others are jokes. The size history of the universe is also embellished for the sake of jokes; the actual size history of the universe has one period of inflation shortly after the Big Bang, followed by comparatively gentle but accelerating expansion. This is artistically depicted in [https://map.gsfc.nasa.gov/media/060915/060915_CMB_Timeline150.jpg this image from NASA]. Part of the humour in this comic comes from the fact that the events leading to the change of the expansion rate not being steady are explained by means that are less likely to exist to "dark matter" and "dark energy". |
The title text is a mathematical joke, based on the Intermediate Value Theorem (IVT). Note that the actual size (A) of the universe is zero at the Big Bang (time t = 0), while the corresponding size of the comic (C) is positive (the shape there has a small but nonzero thickness). Thus, A(0) - C(0) < 0. Also, the actual size of the universe at the present day is larger {{Citation needed}} than the corresponding size of the comic. So we have A(present) - C(present) > 0. Assuming the sizes of the universe and the comic are continuous {{Citation needed}}, by the IVT, there exists a time u in the interval (0, present) such that A(u) - C(u) = 0. Noting such a time u is likely reached very quickly after the Big Bang, it is represented close to the left of the comic. Hence, technically, Randall is correct. | The title text is a mathematical joke, based on the Intermediate Value Theorem (IVT). Note that the actual size (A) of the universe is zero at the Big Bang (time t = 0), while the corresponding size of the comic (C) is positive (the shape there has a small but nonzero thickness). Thus, A(0) - C(0) < 0. Also, the actual size of the universe at the present day is larger {{Citation needed}} than the corresponding size of the comic. So we have A(present) - C(present) > 0. Assuming the sizes of the universe and the comic are continuous {{Citation needed}}, by the IVT, there exists a time u in the interval (0, present) such that A(u) - C(u) = 0. Noting such a time u is likely reached very quickly after the Big Bang, it is represented close to the left of the comic. Hence, technically, Randall is correct. | ||
Revision as of 05:33, 12 December 2019
| Timeline of the Universe |
 Title text: Not actual size, except technically at one spot near the left. |
Explanation
| This is one of 48 incomplete explanations: Created by the BIG BANG. Should include a list of the events, their times, and if they're real, explain what they are, and if they're jokes, explain what they are. Do NOT delete this tag too soon. If you can fix this issue, edit the page! |
This comic is about the size of the universe, presented as a timeline. Some events it describes as being caused by inflation or causing it are real, but others are jokes. The size history of the universe is also embellished for the sake of jokes; the actual size history of the universe has one period of inflation shortly after the Big Bang, followed by comparatively gentle but accelerating expansion. This is artistically depicted in this image from NASA. Part of the humour in this comic comes from the fact that the events leading to the change of the expansion rate not being steady are explained by means that are less likely to exist to "dark matter" and "dark energy".
The title text is a mathematical joke, based on the Intermediate Value Theorem (IVT). Note that the actual size (A) of the universe is zero at the Big Bang (time t = 0), while the corresponding size of the comic (C) is positive (the shape there has a small but nonzero thickness). Thus, A(0) - C(0) < 0. Also, the actual size of the universe at the present day is larger [citation needed] than the corresponding size of the comic. So we have A(present) - C(present) > 0. Assuming the sizes of the universe and the comic are continuous [citation needed], by the IVT, there exists a time u in the interval (0, present) such that A(u) - C(u) = 0. Noting such a time u is likely reached very quickly after the Big Bang, it is represented close to the left of the comic. Hence, technically, Randall is correct.
The events presented in the timeline are:
- ?? (more than 13.8 billion years ago (Gya)): the unknown state of the universe prior to the Big Bang, if such a statement is even sensible (is it possible to be "south of the South Pole"?).
- Big Bang (13.8 Gya): The model of the origin of the universe which has achieved consensus among astronomers. We have observed that all galaxies are receding away from Earth at rates that are roughly proportional to their distance, and the simplest explanation for this is that the universe is expanding. If the universe is expanding, then (unless new physics are discovered) it must have at one time been very, very small and dense; that moment in time is called the Big Bang.
- Planck Epoch: The time period starting with the Big Bang.
- Medium Bang (a joke): If there's a Big Bang, why not have medium one? There should probably also be a Little Bang, but maybe it's just too little to be featured on this chart.
- Inflation (10^-36 to 10^-32 seconds after the Big Bang): A theory developed to explain the large-scale structure of the universe that postulates a period when the universe expanded faster than the speed of light
- Quark Epoch (10^-12 seconds after the Big Bang): The universe is a quark-gluon plasma, up until 10^-6 seconds when it cools enough to coalesce into hadrons, including protons and neutrons.
- Lepton Epoch (1 second after the Big Bang): Leptons, including electrons, and their associated neutrinos dominate.
- Photon Epoch (10 seconds after the Big Bang): The universe is dominated by photons.
- Cool Bug Epoch (possibly a joke): There was a period around 10-17 million years after the Big Bang in which the cosmic background radiation was between 273 and 373 K, the temperature range for liquid water. Cosmologists have speculated that primitive life could have arisen during this period and dubbed it the 'Habitable Epoch of the Early Universe'.
- Molded grip (a joke): Some tools (e.g. knives) have molded finger-wells so that the user's hand settles easily and securely into a comfortable position. This epoch of the universe features repeated expansions and contractions so that this part of the timeline resembles a molded grip, at least in profile (it would be much too large to be held by any known animal's hands)[citation needed].
- Stars form (100 million years after the Big Bang): The universe cools enough to allow ordinary matter particles to group into stars.
- Stagflation (a joke): In addition to cosmic inflation, inflation can also refer to the economic phenomenon in which prices increase over time. Stagflation is combination of the terms "stagnation" and "inflation", and refers to a situation in which monetary inflation is high, economic growth is slow, and job creation is low. This epoch of the universe shows the universe beginning to contract in size, much as economists would talk about an economy contracting.
- Settling (a joke): Perhaps the universe has been very busy, and needs a rest.
- Rebound (a joke): Rest time is finished.
- Someone tripped and accidentally hit the "Inflation" switch again (a joke)
- Emergency Stop triggered (a joke)
- Galaxies form (12.8 Gya)
- Earth forms (4.5 Gya)
- Present day
- Future cosmological development handed over to J.J. Abrams, outcome unknown (a joke): J.J. Abrams is a science-fiction writer and filmmaker. If he were in charge of the future development of the cosmos, he might decide to subject all of us to some strange plot twist. Among many other movies, he has directed the 2009 reboot of Star Trek, in which the "future history" of Star Trek is altered from the timeline of the original series by Nero and Spock traveling backwards in time.
The dashed lines coming off the end of the timeline represent the possible fates of the universe:
- The universe could stop expanding and begin contracting, resulting in the Big Crunch. In our universe, cosmological measurements have shown that the expansion of the universe is accelerating, so the Big Crunch is considered to be the least likely fate.
- The universe could eventually settle into thermal equilibrium, which would leave no energy available for any interesting phenomena to occur. This is called the heat death of the universe or "Big Freeze".
- The universe's expansion could continue accelerating to the point that the accelerating expansion overcomes all forces between particles, turning the universe into a collection of particles isolated from each other by rapidly-expanding space. This is called the Big Rip.
Transcript
| This is one of 45 incomplete transcripts: Do NOT delete this tag too soon. If you can fix this issue, edit the page! |
- Timeline of the Universe
- ??
- Big Bang
- [The Universe comes in as a circle with action lines around it. It stays the same size for a while.]
- Planck Epoch
- Medium Bang
- [The Universe starts inflating very slowly]
- Inflation
- [The Universe briefly inflates very rapidly, and returns to its normal rate of expansion.]
- Quark Epoch
- Lepton Epoch
- Photon Epoch
- Cool Bug Epoch
- [The Universe starts inflating and deflating rapidly, as if to form a grip.]
- Molded grip
- [Stars appear in the timeline. The Universe starts inflating slightly faster than before.]
- Stars form
- Stagflation
- [The Universe starts deflating slowly.]
- Settling
- Rebound
- [The Universe starts inflating slowly again.]
- Someone tripped and accidentally hit the "Inflation" switch again
- [The Universe starts inflating at the same rate as the Inflation section.]
- Emergency Stop triggered
- [The Universe abruptly stops inflating, and stays level.]
- [Galaxies appear in the timeline. The Universe starts inflating at a medium pace.]
- Galaxies form
- Earth forms
- Present day
- [We see the edge of the Universe, with a rounded shape. Various dotted line predictions are on the edges.]
- Future Cosmological development handed over to J.J. Abrams, outcome unknown
Discussion
"Cool Bug Epoch" reminds me of the last panel in 1493 and 2191, but it's probably coincidental.--GoldNinja (talk) 19:44, 11 December 2019 (UTC)
- Reminds me of Cool Bug Fact's DPS2004'); DROP TABLE users;-- (talk) 20:02, 11 December 2019 (UTC)
"The title text is a mathematical joke, based on the Intermediate Value Theorem (IVT)... Hence, technically, Randall is correct." that is assuming that the universe didn't start from anything bigger than this comic. ̶P̶h̶y̶s̶i̶c̶i̶a̶n̶s̶ Physicists, discuss! (okay, fine. philosophers can join too) OtterlyAmazin (talk) 20:41, 11 December 2019 (UTC)
- Even with antialiasing, the intrinsically granular nature of the graymap representing a sub-pixel measure, at any given perpendicular point of the scale at any given device's DPI. I wouldn't put it past the Universe to have skipped-through the gap between values. ...on the other hand, if we get into Big Rip territory, perhaps the effective DPI of any extant representation will pass back through a coincident value. 162.158.34.202 22:09, 11 December 2019 (UTC)
- The models predict the universe to be smaller than a grain of sand even after the inflation so of course the observable universe was at some point smaller than the line width of this drawing and so he is correct. There is no mathematical joke. Randall often jokes about not actual size, but notices that there one point on his graph will actually have been at the actual size. Which is impossible to say, but yes it was probably between inflation and Quark epoch. I have changed the explanation to cover this. --Kynde (talk) 14:47, 12 December 2019 (UTC)
I notice that the events along the top are mostly sensible, while the events at the bottom are mostly not. 108.162.249.220 23:08, 11 December 2019 (UTC)
- Naah that is not so evident. Below there are three correct and 6 wrong and above it is 2 wrong vs 7 correct. So yes most of the incorrect is on the bottom side, but that seems more like a coincidence, since there are wrong and right on either side. --Kynde (talk) 14:47, 12 December 2019 (UTC)
It would be good if this clarified whether the diagram of the growth itself is correct and just badly mislabeled, or if it doesn't even correctly show the size of the universe over time. Gaelan (talk) 00:24, 12 December 2019 (UTC)
- No, this is not the actual diagram, which is a much smoother regular bell shape without the sharp pointy left end. We also don't really know anything about the starting point beyond wild conjecture, as there's lots of uncertainty in the cosmological model, no matter what anyone says. Ianrbibtitlht (talk) 03:08, 12 December 2019 (UTC)
While the explanation mentions the dashed lines for the future fate of the universe, it only lists 3 possibilities, even though there are 4 sets of dashed lines in the diagram. It's possible that the outermost dashed lines represent another mistaken inflation button press. Ianrbibtitlht (talk) 03:16, 12 December 2019 (UTC)
- Have added notice of all four lines to the explanation. Feel free to improve my version of the explanation on them. Agree that one of them could be the idea that the inflation switch was pushed again. --Kynde (talk) 14:47, 12 December 2019 (UTC)
Hey, methinks the title text maybe referring to the lesbegue measure(which for a point is zero) since we are talking about sizes.--Jassi101 (talk) 08:21, 12 December 2019 (UTC)
- No need to invoke complicated math to state that when something expands from zero size to universe size then at some time it must take on any value in between, and thus also fit on this comics drawing. --Kynde (talk) 14:47, 12 December 2019 (UTC) <--- not true if you allow a couple expansions via the higher-order dimensions, then the universe pops back into 3-D with a zero-time-lag & thus a genuine discontinuity without even any Gibbs Overshoot. Cellocgw (talk) 20:12, 12 December 2019 (UTC)
The explanation of the title text is now long and complicated and, for me, hard to follow. Couldn't we just say something simple like this? "Randall's universe diagram is always at least one pixel thick. But the universe started much smaller than one pixel and expanded to the size it is today, so at some time instant it must have passed through the size of Randall's diagram -- making the diagram 'actual size' at that instant." Wouldn't something simple like this be better? I'd do this myself but I'm leery of deleting a lot of other people's writing. DKMell (talk) 20:29, 13 December 2019 (UTC)
explain xkcd talk:Community portal/Miscellaneous#Google Ads